

Question: with steps please, can someone elaborate how i would get A2 ? Suppose that we take 10 samples of size n = 4 from a
with steps please, can someone elaborate how i would get A2 ? 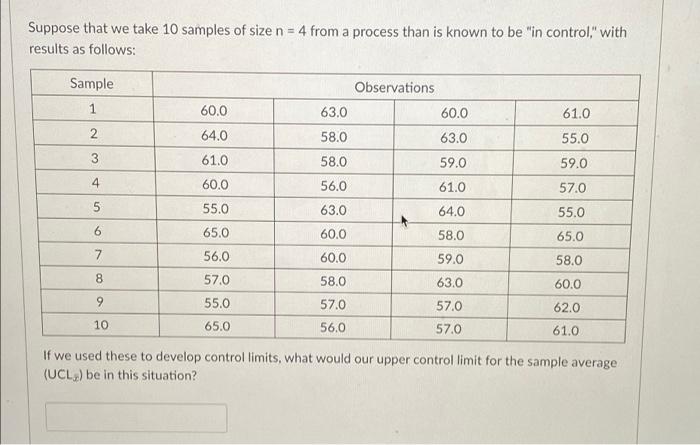
Suppose that we take 10 samples of size n = 4 from a process than is known to be "in control" with results as follows: Sample 1 60.0 61.0 2 64.0 55.0 Observations 63.0 60.0 58.0 63.0 58.0 59.0 56.0 61.0 63.0 64.0 3 59.0 4 61.0 60.0 55.0 57.0 5 55.0 65.0 6 65.0 60.0 60.0 7 58.0 59.0 63.0 58.0 8 56.0 57.0 55.0 65.0 58.0 57.0 56.0 57.0 60.0 62.0 61.0 10 57.0 If we used these to develop control limits, what would our upper controllimit for the sample average (UCL) be in this situation
Step by Step Solution
There are 3 Steps involved in it
1 Expert Approved Answer
Step: 1 Unlock

Question Has Been Solved by an Expert!
Get step-by-step solutions from verified subject matter experts
Step: 2 Unlock
Step: 3 Unlock