

Question: With the above data, a. what are the upper and lower control limits for C chart? Draw the graph of C chart with sample

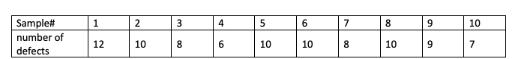
With the above data, a. what are the upper and lower control limits for C chart? Draw the graph of C chart with sample average data. c. Is the process under control? Please explain it? b. Sample# number of defects 1 12 2 10 3 00 8 4 6 5 10 6 10 7 00 8 8 10 9 9 10 7
Step by Step Solution
★★★★★
3.45 Rating (152 Votes )
There are 3 Steps involved in it
1 Expert Approved Answer
Step: 1 Unlock

Question Has Been Solved by an Expert!
Get step-by-step solutions from verified subject matter experts
Step: 2 Unlock
Step: 3 Unlock