Question: With the financial analysis provided below, please help me answer the following questions please use NONPROFIT terminology not business 1. Is the organization maintaining intergenerational
With the financial analysis provided below, please help me answer the following questions please use NONPROFIT terminology not business
1. Is the organization maintaining intergenerational equity?
2. Are present resources sustainable
3. In paragraph form, explain the financial condition of this nonprofit using the data analyzed and review red flags
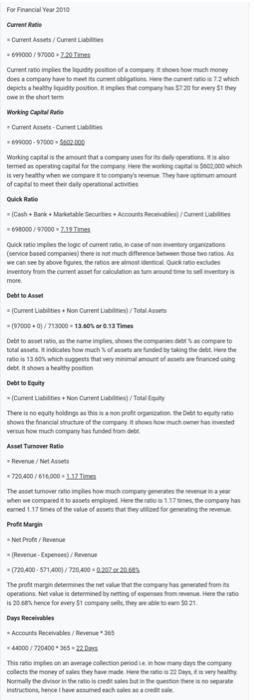
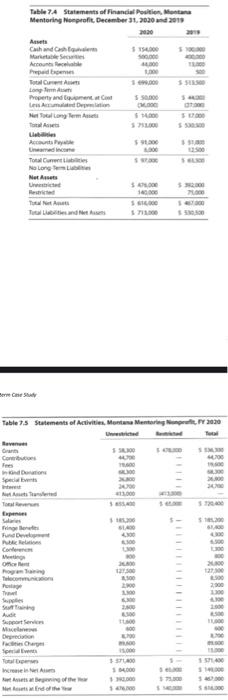
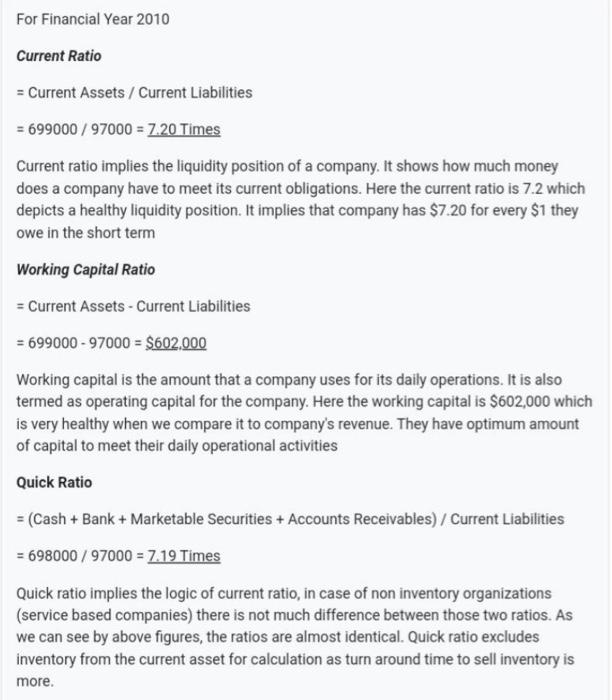
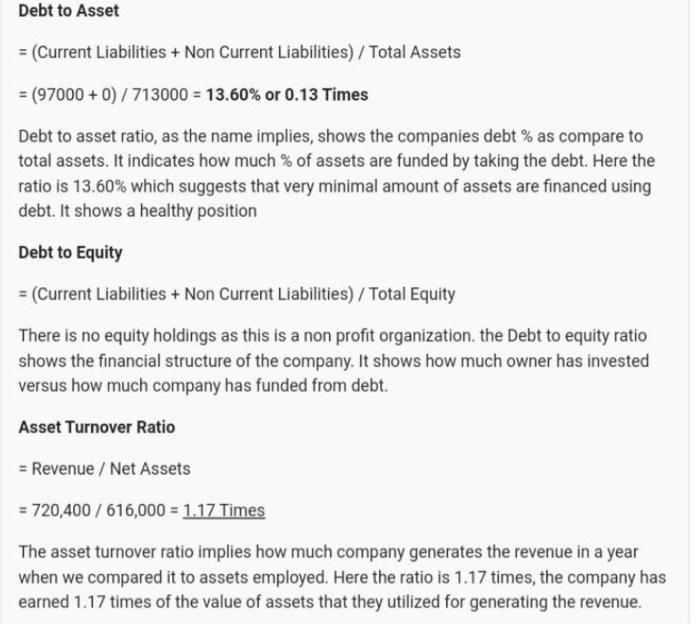
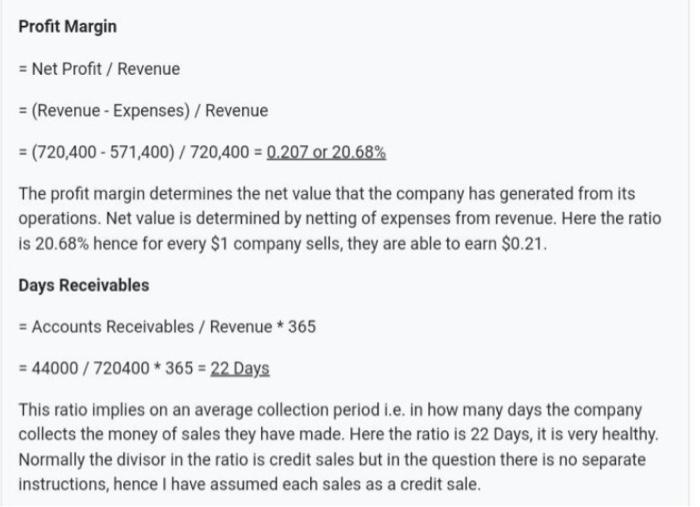
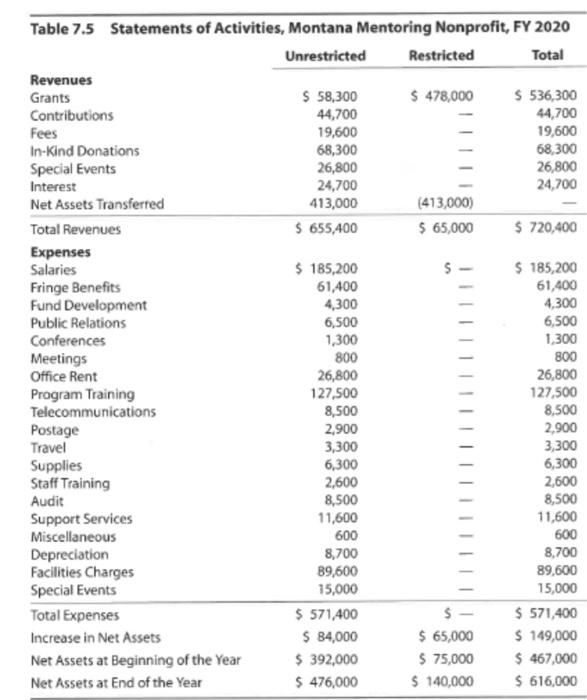
For Financial Year 2010 Current Rutie Current Act/Ourens 6700/97000 Z.Tunes Current romplies the body of a.com too much money does a company have to customer 12 which depicts a tydly putions that com 20 ore they we the short Working Capital Ratio Current Assets 99000-970002.00 Working capitat is the mount that comes for sale med sang capital for the competing which is very healthy when we come to company. They are amount of capital to meet the day operational Quick Ratio Cash + Bark + Marketable Securities Arts de Cuentas 9000 97000 2.19 Times Quick replies the logic of current afmaraton (ervice based companies there is not much difference toets. As we can see by above fures, the most datieces Invertory from the current facilitary more Debt to Asset Current Les Non Current 7000/7180.00 - 13.001 or 0.12 Times Debit to the right total indicates how much of a wed by the dette ratios 1300 which you want debt. It show you Debit to quity Cunettes There is no egun holding as the only to shows the truture of the company thouse versus how the company as funded to be Asset Turnover Ratio Heren Nette 720,00 7610.000 when compared to play the 17th company has cand 1.17es of the value of that they forgeting them Prof Marin Net Profile Pape/ -20400-571400/720.400 0.202020 The poolt margin determines there that the composto operationsfile determined by the 18 20:08 hence for wry competh 9021 Duy Receivables - Accounts 4000/7204003522 This momennage collection how the company colects the money they have made they were Normally the divor in the ratio ist con enchumedech Table 7A Statement of Financial Position. More Mentoring Monprofit December 31, 2020 and 2019 30 A Cath and how MS Account Belle repede Total Care Long Property and mental Le main Melton Termes 5 S Lab Total Current Net Urtet $4.00 10.000 erre Care Table 75 Statements of Activities, Montana Mentering, PY2020 Never Selbs 3.000 100 more Fund Com Office Pogo 2.000 100 20 Suple Su Supporter Mac Depron Charge Toro rest . 37200 100 150 10 Nord of the For Financial Year 2010 Current Ratio = Current Assets / Current Liabilities = 699000 / 97000 = 7.20 Times Current ratio implies the liquidity position of a company. It shows how much money does a company have to meet its current obligations. Here the current ratio is 7.2 which depicts a healthy liquidity position. It implies that company has $7.20 for every $1 they owe in the short term Working Capital Ratio = Current Assets - Current Liabilities = 699000 - 97000 = $602.000 Working capital is the amount that a company uses for its daily operations. It is also termed as operating capital for the company. Here the working capital is $602,000 which is very healthy when we compare it to company's revenue. They have optimum amount of capital to meet their daily operational activities Quick Ratio = (Cash + Bank + Marketable Securities + Accounts Receivables) / Current Liabilities = 698000 / 97000 = 7.19 Times Quick ratio implies the logic of current ratio, in case of non inventory organizations (service based companies) there is not much difference between those two ratios. As we can see by above figures, the ratios are almost identical. Quick ratio excludes inventory from the current asset for calculation as turn around time to sell inventory is more. Debt to Asset = (Current Liabilities + Non Current Liabilities) / Total Assets = (97000 + 0) / 713000 = 13.60% or 0.13 Times Debt to asset ratio, as the name implies, shows the companies debt % as compare to total assets. It indicates how much % of assets are funded by taking the debt. Here the ratio is 13.60% which suggests that very minimal amount of assets are financed using debt. It shows a healthy position Debt to Equity = (Current Liabilities + Non Current Liabilities) / Total Equity There is no equity holdings as this is a non profit organization, the Debt to equity ratio shows the financial structure of the company. It shows how much owner has invested versus how much company has funded from debt. Asset Turnover Ratio = Revenue / Net Assets = 720,400 / 616,000 = 1.17 Times The asset turnover ratio implies how much company generates the revenue in a year when we compared it to assets employed. Here the ratio is 1.17 times, the company has earned 1.17 times of the value of assets that they utilized for generating the revenue. Profit Margin = Net Profit / Revenue = (Revenue - Expenses) / Revenue = (720,400 - 571,400) / 720,400 = 0.207 or 20.68% The profit margin determines the net value that the company has generated from its operations. Net value is determined by netting of expenses from revenue. Here the ratio is 20.68% hence for every $1 company sells, they are able to earn $0.21. Days Receivables = Accounts Receivables / Revenue * 365 = 44000 / 720400 * 365 = 22 Days This ratio implies on an average collection period i.e. in how many days the company collects the money of sales they have made. Here the ratio is 22 Days, it is very healthy. Normally the divisor in the ratio is credit sales but in the question there is no separate instructions, hence I have assumed each sales as a credit sale. Table 7.4 Statements of Financial Position, Montana Mentoring Nonprofit, December 31, 2020 and 2019 2020 2019 $ 154,000 500,000 44,000 1,000 $ 699,000 $ 100,000 400,000 13,000 500 $ 513,500 Assets Cash and Cash Equivalents Marketable Securities Accounts Receivable Prepaid Expenses Total Current Assets Long-Term Assets Property and Equipment, at Cost Less Accumulated Depreciation Net Total Long Term Assets Total Assets Liabilities Accounts Payable Unearned Income Total Current Liabilities No Long Term Liabilities Net Assets Unrestricted Restricted $ 50,000 (36,000) $ 14,000 $ 713,000 $ 44,000 (27,000) $ 17,000 $530,500 $ 91,000 6,000 $ 97,000 $ 51,000 12,500 $ 63,500 $ 476,000 140,000 $ 616,000 $ 713,000 $ 392,000 75,000 $ 467,000 $ 530,500 Total Net Assets Total Liabilities and Net Assets Table 7.5 Statements of Activities, Montana Mentoring Nonprofit, FY 2020 Unrestricted Restricted Total Revenues Grants $ 58,300 $ 478,000 S536,300 Contributions 44,700 44,700 Fees 19,600 19,600 In-Kind Donations 68,300 68,300 Special Events 26,800 26,800 Interest 24,700 24,700 Net Assets Transferred 413,000 (413,000) Total Revenues $ 655,400 $ 65,000 $ 720,400 Expenses Salaries $ 185,200 $ 185,200 Fringe Benefits 61,400 61,400 Fund Development 4,300 4,300 Public Relations 6,500 6,500 Conferences 1,300 1,300 Meetings 800 800 Office Rent 26,800 26,800 Program Training 127,500 127,500 Telecommunications 8,500 8,500 Postage 2,900 2,900 Travel 3,300 3,300 Supplies 6,300 6,300 Staff Training 2,600 2,600 Audit 8,500 8,500 Support Services 11,600 11,600 Miscellaneous 600 600 Depreciation 8,700 8,700 Facilities Charges 89,600 89,600 Special Events 15,000 15,000 Total Expenses $ 571,400 $- $ 571,400 Increase in Net Assets $ 84,000 $ 65,000 $ 149,000 Net Assets at Beginning of the Year $ 392,000 $ 75,000 $ 467,000 Net Assets at End of the Year $ 476,000 $ 140,000 $ 616,000 For Financial Year 2010 Current Rutie Current Act/Ourens 6700/97000 Z.Tunes Current romplies the body of a.com too much money does a company have to customer 12 which depicts a tydly putions that com 20 ore they we the short Working Capital Ratio Current Assets 99000-970002.00 Working capitat is the mount that comes for sale med sang capital for the competing which is very healthy when we come to company. They are amount of capital to meet the day operational Quick Ratio Cash + Bark + Marketable Securities Arts de Cuentas 9000 97000 2.19 Times Quick replies the logic of current afmaraton (ervice based companies there is not much difference toets. As we can see by above fures, the most datieces Invertory from the current facilitary more Debt to Asset Current Les Non Current 7000/7180.00 - 13.001 or 0.12 Times Debit to the right total indicates how much of a wed by the dette ratios 1300 which you want debt. It show you Debit to quity Cunettes There is no egun holding as the only to shows the truture of the company thouse versus how the company as funded to be Asset Turnover Ratio Heren Nette 720,00 7610.000 when compared to play the 17th company has cand 1.17es of the value of that they forgeting them Prof Marin Net Profile Pape/ -20400-571400/720.400 0.202020 The poolt margin determines there that the composto operationsfile determined by the 18 20:08 hence for wry competh 9021 Duy Receivables - Accounts 4000/7204003522 This momennage collection how the company colects the money they have made they were Normally the divor in the ratio ist con enchumedech Table 7A Statement of Financial Position. More Mentoring Monprofit December 31, 2020 and 2019 30 A Cath and how MS Account Belle repede Total Care Long Property and mental Le main Melton Termes 5 S Lab Total Current Net Urtet $4.00 10.000 erre Care Table 75 Statements of Activities, Montana Mentering, PY2020 Never Selbs 3.000 100 more Fund Com Office Pogo 2.000 100 20 Suple Su Supporter Mac Depron Charge Toro rest . 37200 100 150 10 Nord of the For Financial Year 2010 Current Ratio = Current Assets / Current Liabilities = 699000 / 97000 = 7.20 Times Current ratio implies the liquidity position of a company. It shows how much money does a company have to meet its current obligations. Here the current ratio is 7.2 which depicts a healthy liquidity position. It implies that company has $7.20 for every $1 they owe in the short term Working Capital Ratio = Current Assets - Current Liabilities = 699000 - 97000 = $602.000 Working capital is the amount that a company uses for its daily operations. It is also termed as operating capital for the company. Here the working capital is $602,000 which is very healthy when we compare it to company's revenue. They have optimum amount of capital to meet their daily operational activities Quick Ratio = (Cash + Bank + Marketable Securities + Accounts Receivables) / Current Liabilities = 698000 / 97000 = 7.19 Times Quick ratio implies the logic of current ratio, in case of non inventory organizations (service based companies) there is not much difference between those two ratios. As we can see by above figures, the ratios are almost identical. Quick ratio excludes inventory from the current asset for calculation as turn around time to sell inventory is more. Debt to Asset = (Current Liabilities + Non Current Liabilities) / Total Assets = (97000 + 0) / 713000 = 13.60% or 0.13 Times Debt to asset ratio, as the name implies, shows the companies debt % as compare to total assets. It indicates how much % of assets are funded by taking the debt. Here the ratio is 13.60% which suggests that very minimal amount of assets are financed using debt. It shows a healthy position Debt to Equity = (Current Liabilities + Non Current Liabilities) / Total Equity There is no equity holdings as this is a non profit organization, the Debt to equity ratio shows the financial structure of the company. It shows how much owner has invested versus how much company has funded from debt. Asset Turnover Ratio = Revenue / Net Assets = 720,400 / 616,000 = 1.17 Times The asset turnover ratio implies how much company generates the revenue in a year when we compared it to assets employed. Here the ratio is 1.17 times, the company has earned 1.17 times of the value of assets that they utilized for generating the revenue. Profit Margin = Net Profit / Revenue = (Revenue - Expenses) / Revenue = (720,400 - 571,400) / 720,400 = 0.207 or 20.68% The profit margin determines the net value that the company has generated from its operations. Net value is determined by netting of expenses from revenue. Here the ratio is 20.68% hence for every $1 company sells, they are able to earn $0.21. Days Receivables = Accounts Receivables / Revenue * 365 = 44000 / 720400 * 365 = 22 Days This ratio implies on an average collection period i.e. in how many days the company collects the money of sales they have made. Here the ratio is 22 Days, it is very healthy. Normally the divisor in the ratio is credit sales but in the question there is no separate instructions, hence I have assumed each sales as a credit sale. Table 7.4 Statements of Financial Position, Montana Mentoring Nonprofit, December 31, 2020 and 2019 2020 2019 $ 154,000 500,000 44,000 1,000 $ 699,000 $ 100,000 400,000 13,000 500 $ 513,500 Assets Cash and Cash Equivalents Marketable Securities Accounts Receivable Prepaid Expenses Total Current Assets Long-Term Assets Property and Equipment, at Cost Less Accumulated Depreciation Net Total Long Term Assets Total Assets Liabilities Accounts Payable Unearned Income Total Current Liabilities No Long Term Liabilities Net Assets Unrestricted Restricted $ 50,000 (36,000) $ 14,000 $ 713,000 $ 44,000 (27,000) $ 17,000 $530,500 $ 91,000 6,000 $ 97,000 $ 51,000 12,500 $ 63,500 $ 476,000 140,000 $ 616,000 $ 713,000 $ 392,000 75,000 $ 467,000 $ 530,500 Total Net Assets Total Liabilities and Net Assets Table 7.5 Statements of Activities, Montana Mentoring Nonprofit, FY 2020 Unrestricted Restricted Total Revenues Grants $ 58,300 $ 478,000 S536,300 Contributions 44,700 44,700 Fees 19,600 19,600 In-Kind Donations 68,300 68,300 Special Events 26,800 26,800 Interest 24,700 24,700 Net Assets Transferred 413,000 (413,000) Total Revenues $ 655,400 $ 65,000 $ 720,400 Expenses Salaries $ 185,200 $ 185,200 Fringe Benefits 61,400 61,400 Fund Development 4,300 4,300 Public Relations 6,500 6,500 Conferences 1,300 1,300 Meetings 800 800 Office Rent 26,800 26,800 Program Training 127,500 127,500 Telecommunications 8,500 8,500 Postage 2,900 2,900 Travel 3,300 3,300 Supplies 6,300 6,300 Staff Training 2,600 2,600 Audit 8,500 8,500 Support Services 11,600 11,600 Miscellaneous 600 600 Depreciation 8,700 8,700 Facilities Charges 89,600 89,600 Special Events 15,000 15,000 Total Expenses $ 571,400 $- $ 571,400 Increase in Net Assets $ 84,000 $ 65,000 $ 149,000 Net Assets at Beginning of the Year $ 392,000 $ 75,000 $ 467,000 Net Assets at End of the Year $ 476,000 $ 140,000 $ 616,000