

Question: With the financial objectives and assumptions presented below, prepare the following for the company: a) Projected statement of income for 2014 b) Projected statement of
With the financial objectives and assumptions presented below, prepare the following for the company: a) Projected statement of income for 2014 b) Projected statement of changes in equity for 2014 c) Projected statement of financial position for 2014 d) Projected statement of cash flows for 2014 e) Financial ratios for 2014, comparing them with the 2013 financial results Also, calculate the following: f) The companys 2014 sustainable growth rate g) The companys 2014 Z-score
Financial objectives and assumptions: 1. Related to the statement of income: Revenue will increase by 10.0%. Cost of sales as a percentage of revenue will decline to 51.5%. Distribution costs as a percentage of revenue will improve slightly to 10.5%. General and administrative expenses will drop to 5.7% of revenue. Research and development costs as a percentage of revenue will increase to 2.0%. Depreciation/amortization will be $120,000. Other income will be $6,000. Finance costs will be $35,000. Income tax rate (as a percent of profit before taxes) will be maintained at the 2013 level. 2. Related to the statement of changes in equity: $50,000 in dividends will be paid to shareholders. 3. Related to the statement of financial position: a. Non-current asset accounts Investment in new capital assets will be $660,000. Other assets will be increased by $100,000. b. Current asset accounts Inventories will improve to 4.9 times. Trade receivables will improve to 44.9 days. Cash and cash equivalents will be 2.0% of revenue. c. Equity Shareholders will invest an additional $200,000 in the business. d. Non-current liabilities Long-term borrowings will increase by $39,700. e. Current liabilities Trade and other payables will increase to 11.31% of cost of sales.
Notes payable will increase to $268,685. 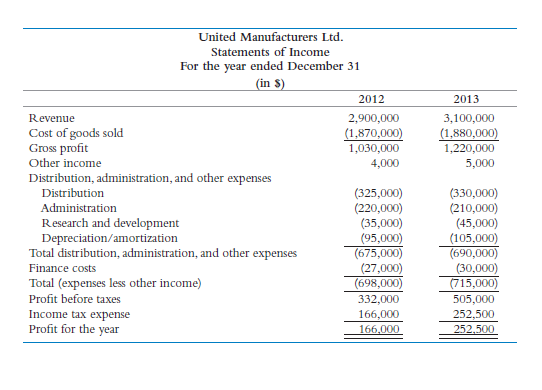
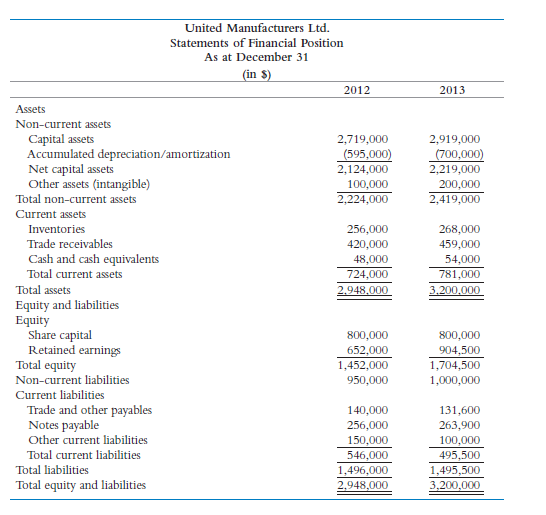
2013 3,100,000 (1.880,000) 1,220,000 5,000 United Manufacturers Ltd. Statements of Income For the year ended December 31 (in s) 2012 Revenue 2,900,000 Cost of goods sold (1,870,000) Gross profit 1,030,000 Other income 4,000 Distribution, administration, and other expenses Distribution (325,000) Administration (220,000) Research and development (35,000) Depreciation/amortization (95,000) Total distribution, administration, and other expenses (675,000) Finance costs (27,000) Total (expenses less other income) (698,000) Profit before taxes 332,000 Income tax expense 166,000 Profit for the year 166,000 (330,000) (210,000) (45,000) (105,000) (690,000) (30,000) (715,000) 505,000 252,500 252.500 2013 2.919,000 (700,000) 2.219,000 200,000 2,419,000 United Manufacturers Ltd. Statements of Financial Position As at December 31 (in $) 2012 Assets Non-current assets Capital assets 2,719,000 Accumulated depreciation/amortization (595,000) Net capital assets 2,124,000 Other assets (intangible) 100,000 Total non-current assets 2,224,000 Current assets Inventories 256,000 Trade receivables 420,000 Cash and cash equivalents 48,000 Total current assets 724,000 Total assets 2.948.000 Equity and liabilities Equity Share capital 800,000 Retained earnings 652,000 Total equity 1,452,000 Non-current liabilities 950,000 Current liabilities Trade and other payables 140,000 Notes payable 256,000 Other current liabilities 150,000 Total current liabilities 546,000 Total liabilities 1,496,000 Total equity and liabilities 2.948,000 268,000 459,000 54,000 781,000 3.200.000 800,000 904,500 1,704,500 1,000,000 131,600 263,900 100,000 495,500 1,495,500 3,200,000 2013 3,100,000 (1.880,000) 1,220,000 5,000 United Manufacturers Ltd. Statements of Income For the year ended December 31 (in s) 2012 Revenue 2,900,000 Cost of goods sold (1,870,000) Gross profit 1,030,000 Other income 4,000 Distribution, administration, and other expenses Distribution (325,000) Administration (220,000) Research and development (35,000) Depreciation/amortization (95,000) Total distribution, administration, and other expenses (675,000) Finance costs (27,000) Total (expenses less other income) (698,000) Profit before taxes 332,000 Income tax expense 166,000 Profit for the year 166,000 (330,000) (210,000) (45,000) (105,000) (690,000) (30,000) (715,000) 505,000 252,500 252.500 2013 2.919,000 (700,000) 2.219,000 200,000 2,419,000 United Manufacturers Ltd. Statements of Financial Position As at December 31 (in $) 2012 Assets Non-current assets Capital assets 2,719,000 Accumulated depreciation/amortization (595,000) Net capital assets 2,124,000 Other assets (intangible) 100,000 Total non-current assets 2,224,000 Current assets Inventories 256,000 Trade receivables 420,000 Cash and cash equivalents 48,000 Total current assets 724,000 Total assets 2.948.000 Equity and liabilities Equity Share capital 800,000 Retained earnings 652,000 Total equity 1,452,000 Non-current liabilities 950,000 Current liabilities Trade and other payables 140,000 Notes payable 256,000 Other current liabilities 150,000 Total current liabilities 546,000 Total liabilities 1,496,000 Total equity and liabilities 2.948,000 268,000 459,000 54,000 781,000 3.200.000 800,000 904,500 1,704,500 1,000,000 131,600 263,900 100,000 495,500 1,495,500 3,200,000
Step by Step Solution
There are 3 Steps involved in it

Get step-by-step solutions from verified subject matter experts