

Question: With the following data, determine: a. range b. interquartile interval c. interfractile interval between the first and second third. The values correspond to the age

With the following data, determine: a. range b. interquartile interval c. interfractile interval between the first and second third. The values correspond to the age of a group of physics students: 18 25 19 21 20 30 25 28 22 26
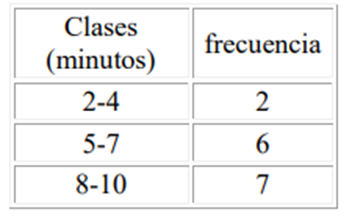
Please round to two decimal places when necessary. Consider the following sample of people visiting an office in a day. Persons 20 15 15 10 to. Calculate the standard deviation for this sample. b. If the distribution is biased, it determines the interval between plus or minus 2 standard deviations. c. How many data in the sample are estimated to fall in the interval calculated in the previous question? 4 The following table corresponds to the duration of a sample of phone calls (in minutes).
Step by Step Solution
There are 3 Steps involved in it

Get step-by-step solutions from verified subject matter experts