

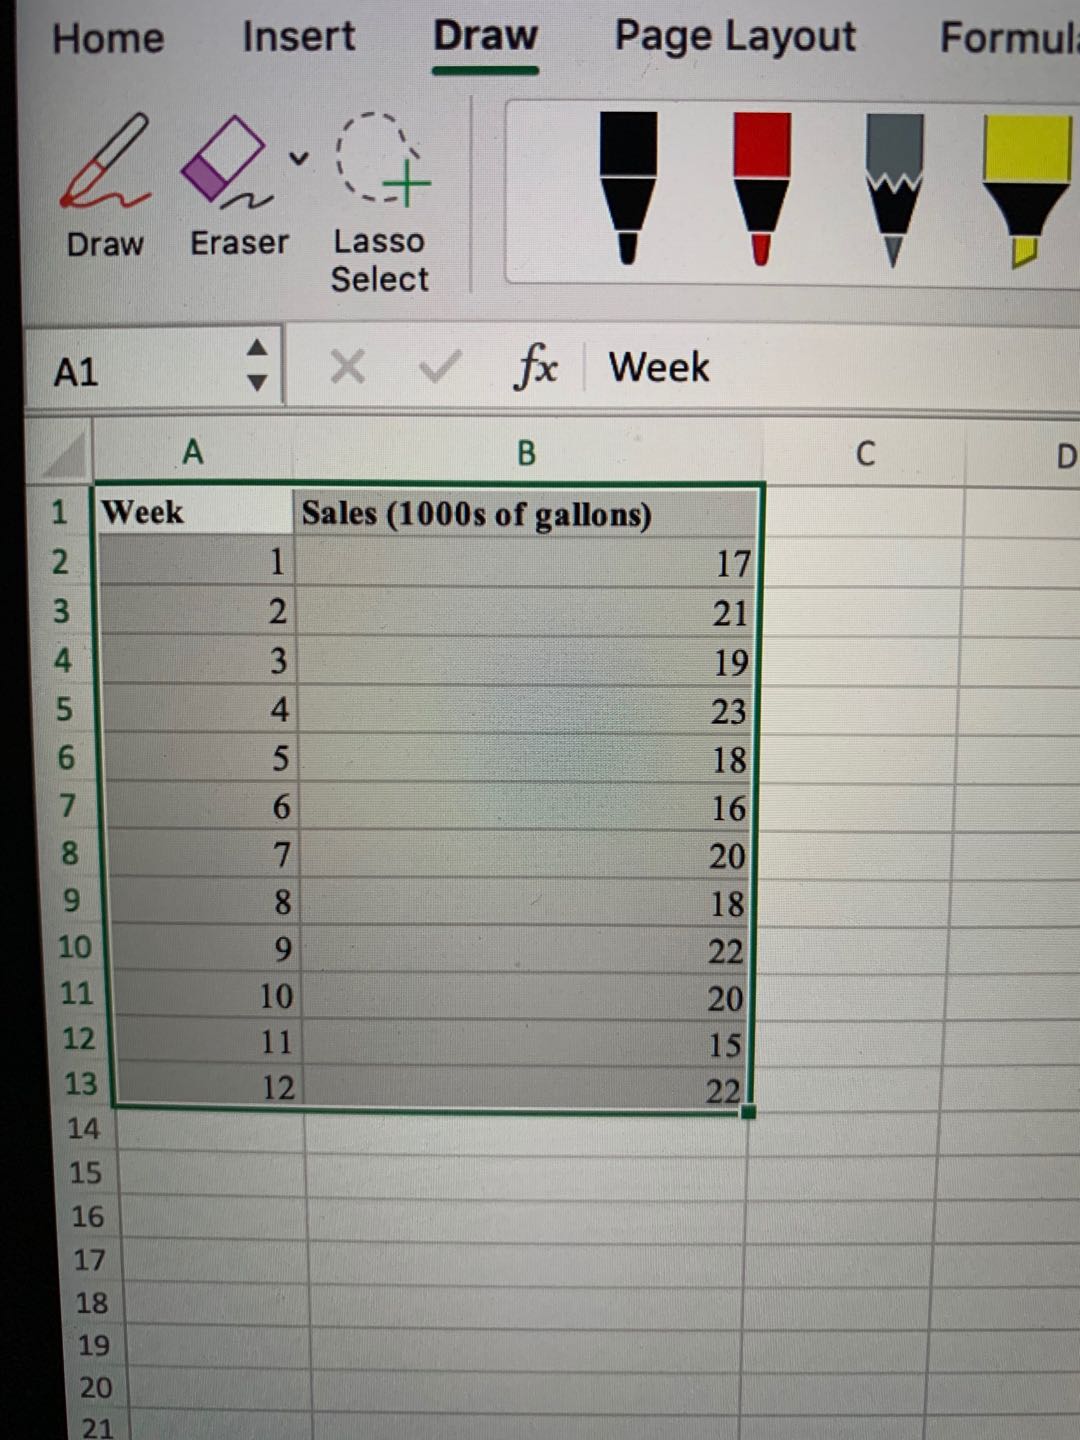
Question: With the gasoline time series data from Table 8.1, show the exponential smoothing forecasts using ?=0.1. Applying the MSE measure of forecast accuracy, would you
With the gasoline time series data from Table 8.1, show the exponential smoothing forecasts using ?=0.1.
- Applying the MSE measure of forecast accuracy, would you prefer a smoothing
- constant of ?=0.1 or ?=0.2 for the gasoline sales time series?
- Are the results the same if you apply MAE as the measure of accuracy?
- What are the results if MAPE is used?
\f
Step by Step Solution
There are 3 Steps involved in it
1 Expert Approved Answer
Step: 1 Unlock

Question Has Been Solved by an Expert!
Get step-by-step solutions from verified subject matter experts
Step: 2 Unlock
Step: 3 Unlock