

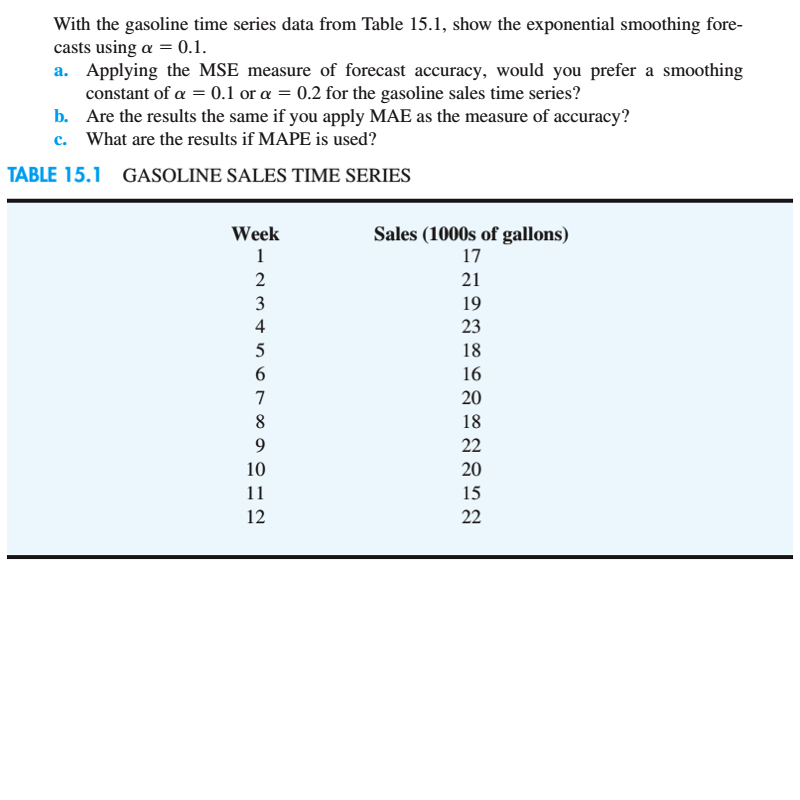
Question: With the gasoline time series data from Table 15.1, show the exponential smoothing forecasts using a 5 0.1. a. Applying the MSE measure of forecast
With the gasoline time series data from Table 15.1, show the exponential smoothing forecasts using a 5 0.1. a. Applying the MSE measure of forecast accuracy, would you prefer a smoothing constant of a 5 0.1 or a 5 0.2 for the gasoline sales time series? b. Are the results the same if you apply MAE as the measure of accuracy? c. What are the results if MAPE is used?
1With the gasoline time series data from Table 15.1, show the exponential smoothing fore- casts using a = {1.1. a. Applying the MSE measure of forecast accuracy, would you prefer a smoothing constant of o = 0.1 or a = 0.2 for the gasoline sales time series? h. Are the results the same if you apply MAE as the measure of accuracy? c. What are the results if MAPE is used? TABLE 15.] GASOIJNE SALES TIME SERIES Week Sales (100115 of gallons) 1 l7 2 21 3 19 4 23 5 13 6 16 7 20 8 13 9 22 10 20 ll 15 12 22
Step by Step Solution
There are 3 Steps involved in it

Get step-by-step solutions from verified subject matter experts