

Question: With the image attached, can you explain what the statistics mean and what's good or bad about them. Figure 7: Annual growth in total pay
With the image attached, can you explain what the statistics mean and what's good or bad about them.
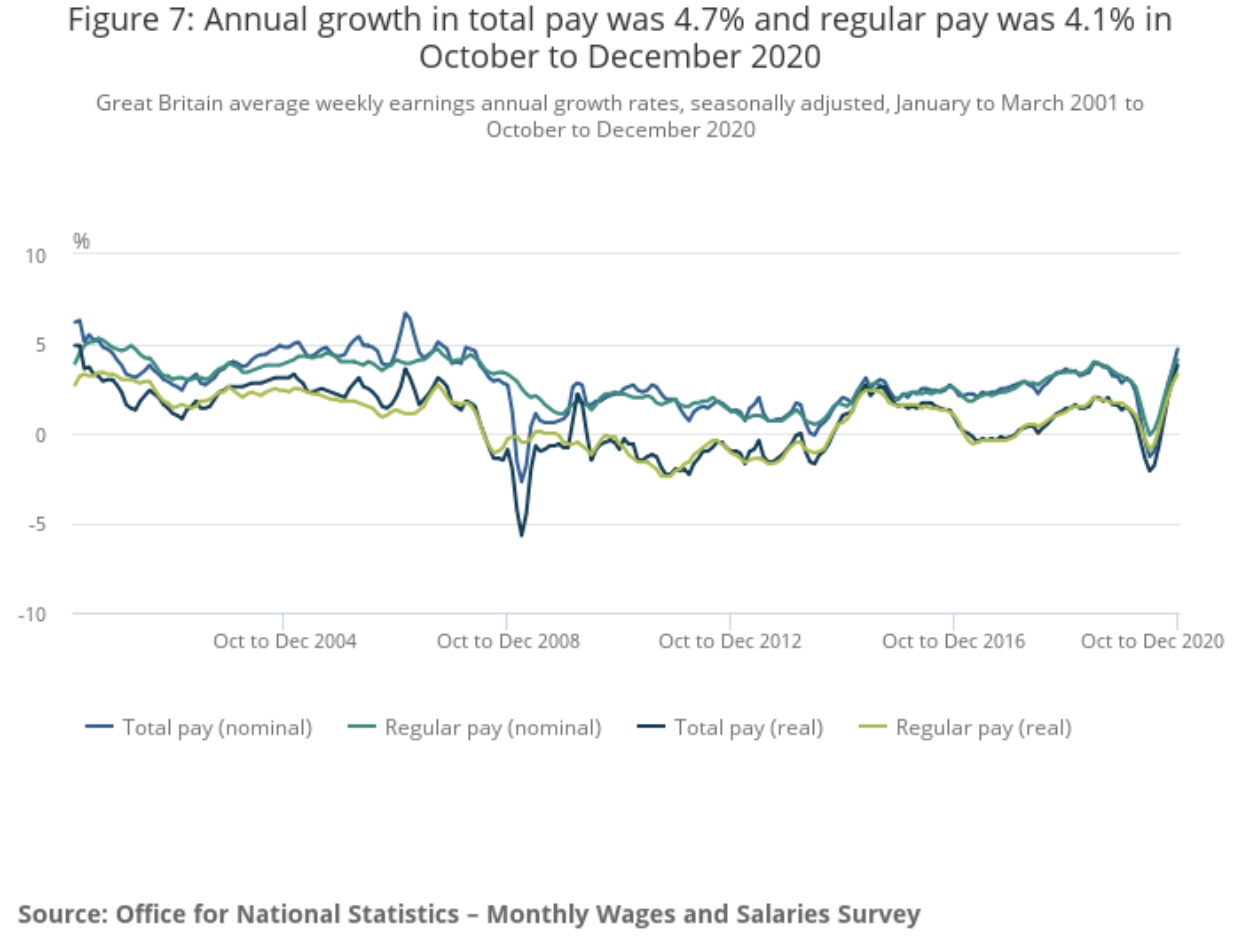
Figure 7: Annual growth in total pay was 4.7% and regular pay was 4.1% in October to December 2020 Great Britain average weekly earnings annual growth rates, seasonally adjusted, January to March 2001 to October to December 2020 96 10 5 0 -5 -10 Oct to Dec 2004 Oct to Dec 2008 Oct to Dec 2012 Oct to Dec 2016 Oct to Dec 2020 - Total pay (nominal) - Regular pay (nominal) - Total pay (real) - Regular pay (real) Source: Office for National Statistics - Monthly Wages and Salaries Survey
Step by Step Solution
There are 3 Steps involved in it
1 Expert Approved Answer
Step: 1 Unlock

Question Has Been Solved by an Expert!
Get step-by-step solutions from verified subject matter experts
Step: 2 Unlock
Step: 3 Unlock