

Question: With the information provided can you please help me answer these four questions, I'm struggling this semester in physics :(1. Describe the linearization process you
With the information provided can you please help me answer these four questions, I'm struggling this semester in physics :(1. Describe the linearization process you used to graph the data and how you obtained the value for the acceleration. The words quadratic, linearization, slope, and axis should be included (I.e explain the difference between d vs. t^2 and d va. T.2. Does the tubular value agree with the expected value? Does the tubular value agree with the graphical values? For now, agreement means that the values fall within the standard deviation. If not, describe the types of errors that could have led to the discrepancy. 3. What is the percent difference between the graphical results and the tubular result? 4. Service the highlighted kinematic equations from the introduction/theory section of this lab manual. (y=y0+v0yt-1/2gt^2
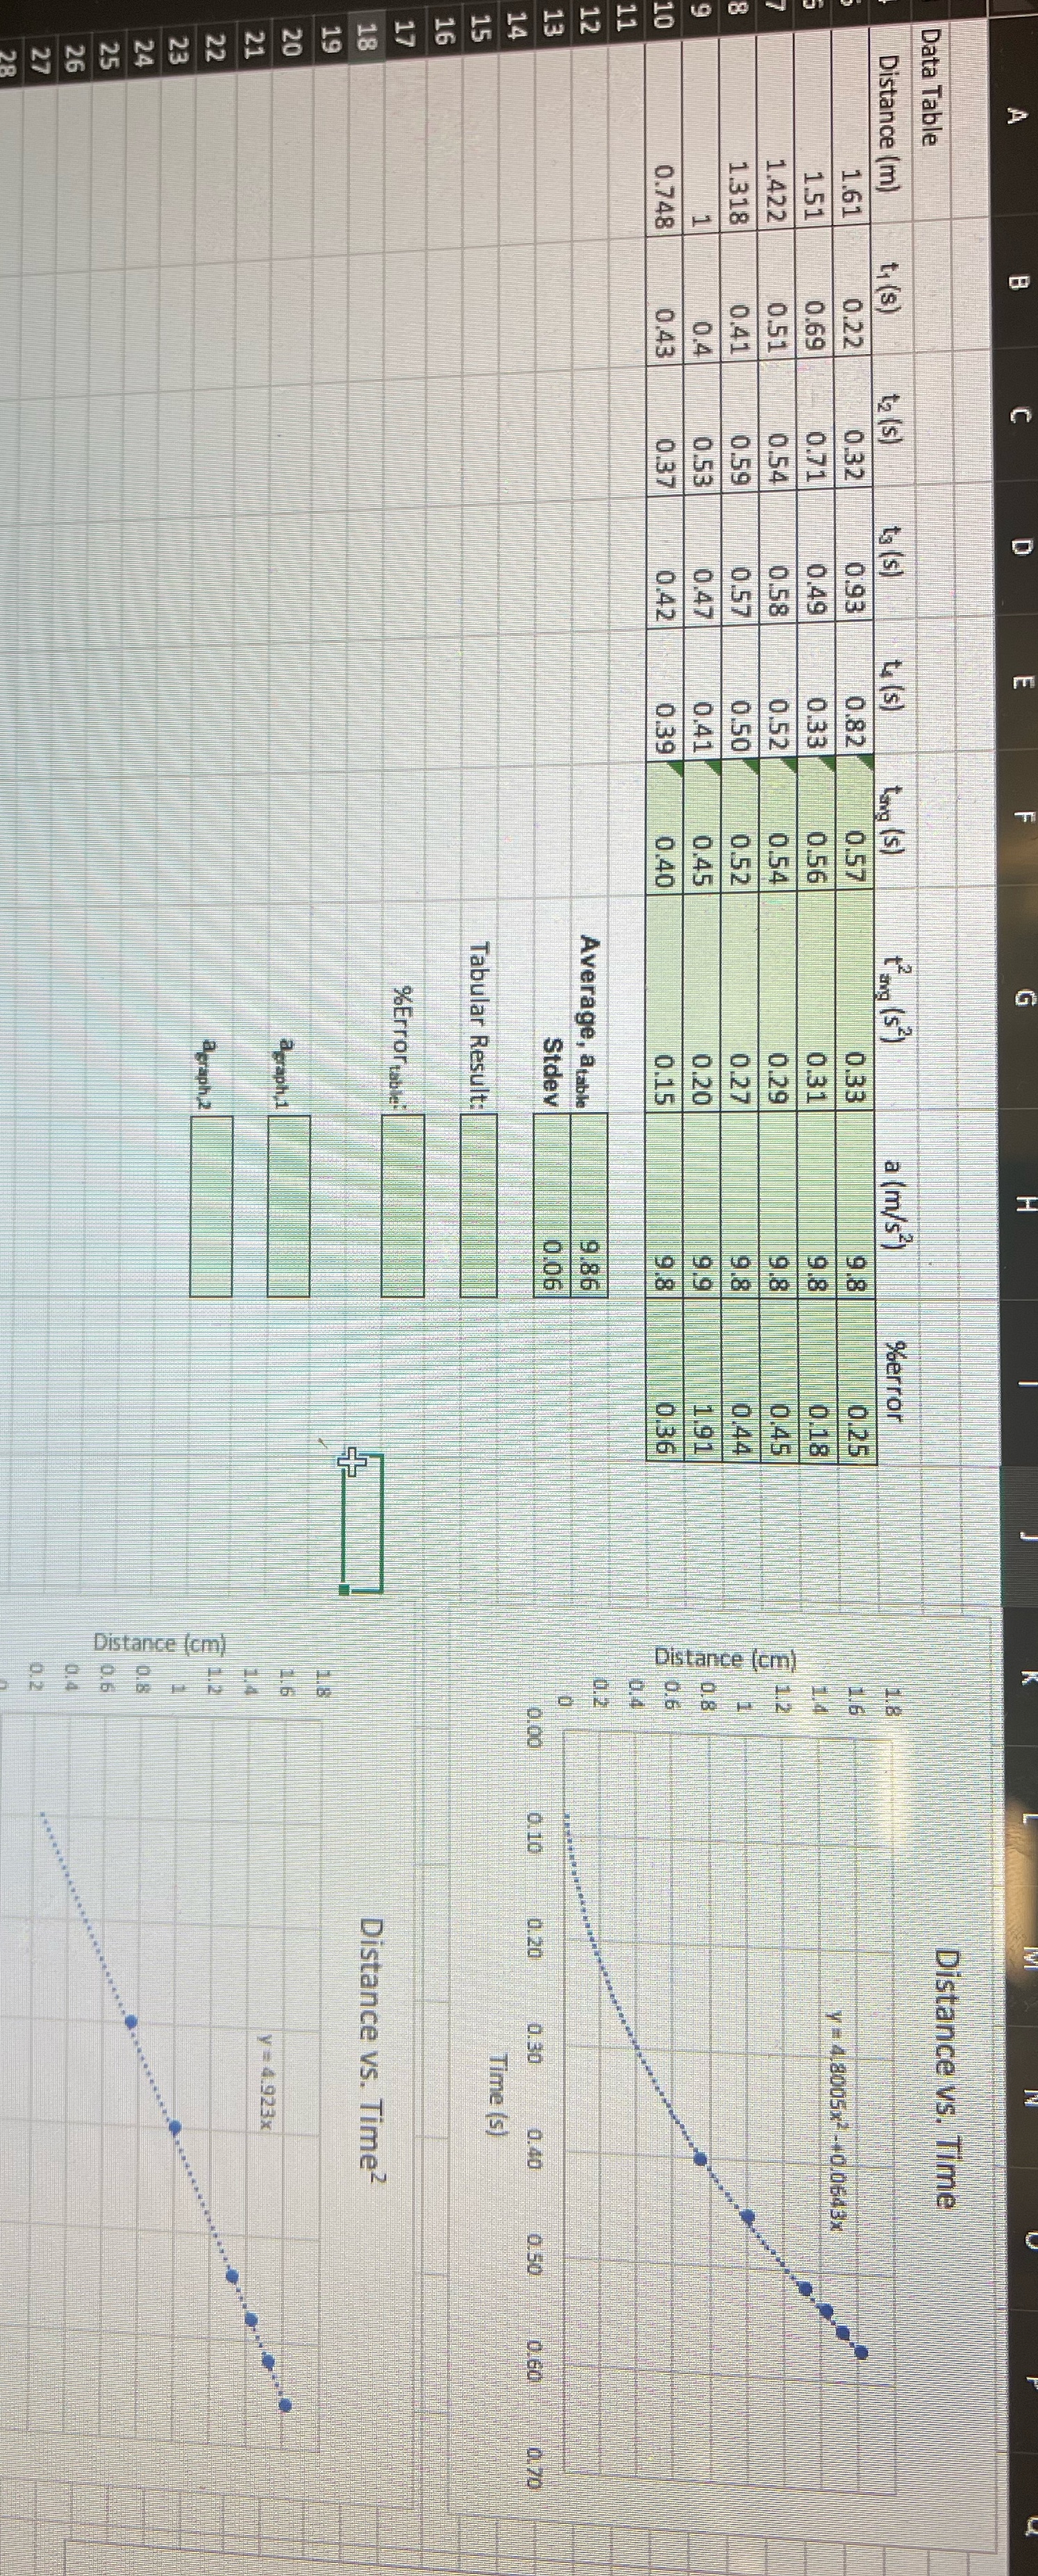
Distance vs. Time Data Table Distance (m) t1 (s) t2 ( s) ts (s) to (s) tong ( s) tang (s ?) a (m/s? ) "error 1.61 0.22 0.32 0.93 0.82 0.57 0.33 0.25 y = 4.8005x2-40.0643x 1.51 0.69 0.71 0.49 0.33 0.56 0.31 0.18 1.422 0.51 0.54 0.58 0.52 0.54 0.29 0.45 1.318 0.41 0.59 0.57 0.50 0.52 0.27 0.44 Distance (cm) 0.4 0.53 0.47 0.41 0.45 0.20 1.91 0.748 0.43 0.37 0.42 0.39 0.40 0.15 0.36 Average, atable 9.86 Stdev 0.06 0.00 0.10 0.20 0.30 0.40 0.50 0.60 1 0.70 Time (s) Tabular Result: %Error table: Distance vs. Time2 agraph,1 y = 4.923x agraph,2 Distance (cm)
Step by Step Solution
There are 3 Steps involved in it

Get step-by-step solutions from verified subject matter experts