

Question: With this code to start, These objects should initially have a fill of white ( color _ rgb ( 2 5 5 , 2 5
With this code to start, These objects should initially have a fill of white colorrgb and then when the
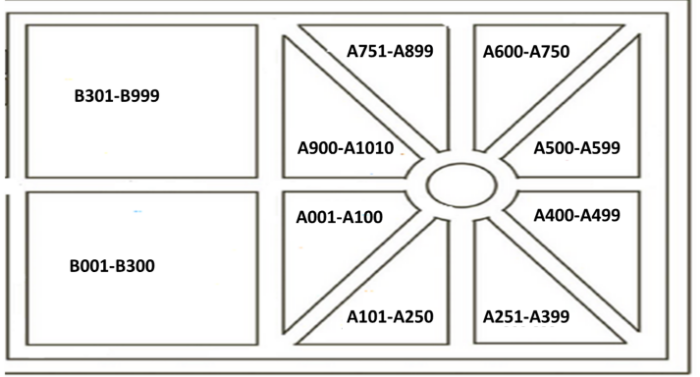
user clicks the mouse anywhere in the graphics window, should display a visualization of the
aggregate sum total number of burials that occurred in each section of the cemetery during the
year period. One click should show all of the burials in the data file, with color shades that
make sense in representing the given data.
In other words, your program should initially show the "map" of the cemetery with all areas
having a default or "white" fill. When the user clicks the mouse, it should then show the
cumulative burials after all seven years, so an accumulation of all of the burials that occurred
over the seven years up to and including the year Note, in this basic assignment, the user
only clicks once, and ALL of the data for ALL of the burials over ALL seven years shows as
color fills in the map ONCE.
The image above shows an example of how your final visualization might look but with
different data, so as to not give the solution away
Intuitively, with most colors, the darker areas indicate sections that have more burials than the
lighter areas. Red is perhaps, an exception to that rule, as a redder red may be intuitively read
as having more burials than a darker red. The choice of color and implementation of the various
shades of the color are critical to the successful completion of this assignment. It is up to you to
choose the color and the shades that you think best represent the total number of burials in a
giveimport turtle
# Set up the turtle environment
screen turtle.Screen
screen.setupwidth height
t turtle.Turtle
tspeed
# Function to draw a rectangle
def drawrectanglex y width, height, fillcolor:
tpenup
tgotox y
tpendown
tfillcolorfillcolor
tbeginfill
for in range:
tforwardwidth
tright
tforwardheight
tright
tendfill
# Function to get burial counts from user
def getburialcounts:
sections Section A 'Section B 'Section C 'Section D
burialcounts
for section in sections:
count intinputfEnter the number of burials for section:
burialcountssection count
return burialcounts
# Function to color sections based on burial count
def colorsectionsburialcounts:
maxburials maxburialcounts.values
# Example section positions and sizes
sectiondata
'Section A
'Section B
'Section C
'Section D
for x
y width, height, section in sectiondata:
burialcount burialcountssection
# Normalize burial count to color
shade burialcount maxburials if maxburials else
fillcolor shade # Shades of red
drawrectanglex y width, height, fillcolor
# Draw the initial map with white rectangles
def drawinitialmap:
sectiondata
for x y width, height in sectiondata:
drawrectanglex y width, height, # White fill for initial state
# Get burial counts from user
burialcounts getburialcounts
# Draw the initial map
drawinitialmap
# On click, color sections based on burial data
screen.onclicklambda x y: colorsectionsburialcounts thideturtle
# Keep the window open until clicked
screen.exitonclick
Step by Step Solution
There are 3 Steps involved in it
1 Expert Approved Answer
Step: 1 Unlock

Question Has Been Solved by an Expert!
Get step-by-step solutions from verified subject matter experts
Step: 2 Unlock
Step: 3 Unlock