

Question: With z =3, the control limits for the mean chart are : UCLx- ____________ ounces (round to three decimal places) LCLx- ______________ ounces (round to
With z =3, the control limits for the mean chart are :
UCLx- ____________ ounces (round to three decimal places)
LCLx- ______________ ounces (round to three decimal places)
c) the control limits for the R-chart are:
UCLr= _______________________________ ounces (round tot hree decimal places)
LCLR= ____________________ ounces (round to three decimal places)
Based on the x chart is one or more samples beyond the conrol limits yes/ no
based on the r chart is one or more samples beyond the control limits? yes/ no
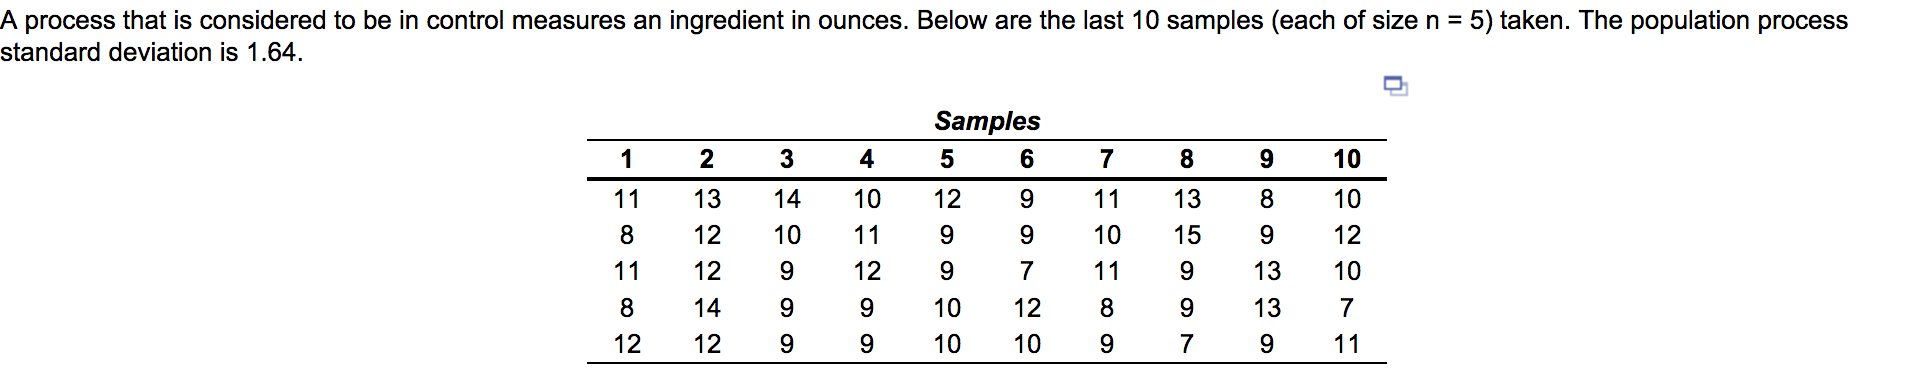
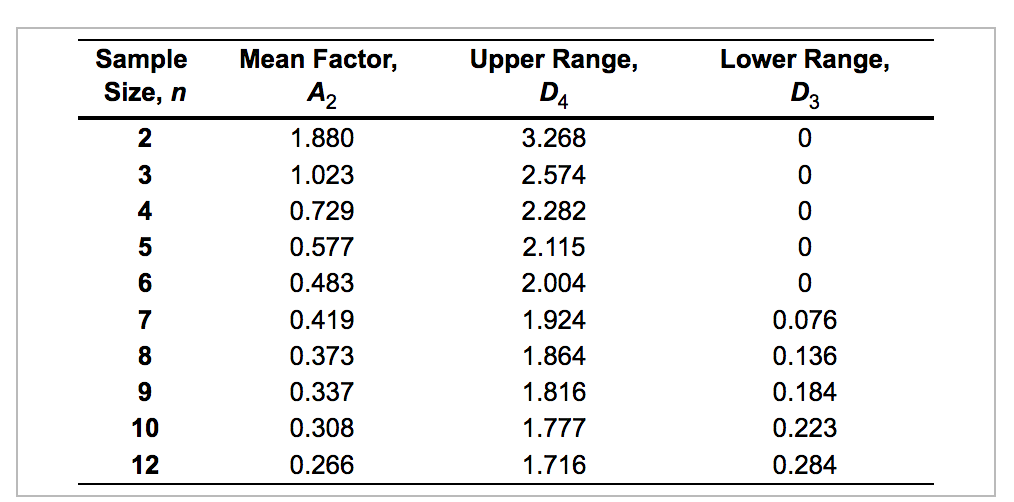
A process that is considered to be in control measures an ingredient in ounces. Below are the last 10 samples (each of size n = 5) taken. The population process standard deviation is 1.64. Samples 5 6 1 2 3 4 7 8 9 10 11 13 14 12 9 11 8 10 11 13 15 8 12 10 9 9 9 10 11 10 12 10 11 12 9 12 9 7 9 13 8 14 9 9 8 9 7 10 10 12 10 13 9 12 12 9 9 9 7 11 Sample Size, n Lower Range, D3 2 0 3 4 0 0 5 Mean Factor, A2 1.880 1.023 0.729 0.577 0.483 0.419 0.373 0.337 0.308 0.266 Upper Range, D4 3.268 2.574 2.282 2.115 2.004 1.924 1.864 1.816 1.777 1.716 O O 6 7 8 9 0.076 0.136 0.184 0.223 0.284 10 12Step by Step Solution
There are 3 Steps involved in it
1 Expert Approved Answer
Step: 1 Unlock

Question Has Been Solved by an Expert!
Get step-by-step solutions from verified subject matter experts
Step: 2 Unlock
Step: 3 Unlock