

Question: Without using an excel spreadsheet (just a financial calculator) how did they find the answers to fill out the NPV Table? SENSITIVITY ANALYSIS Expected Values
Without using an excel spreadsheet (just a financial calculator) how did they find the answers to fill out the NPV Table? 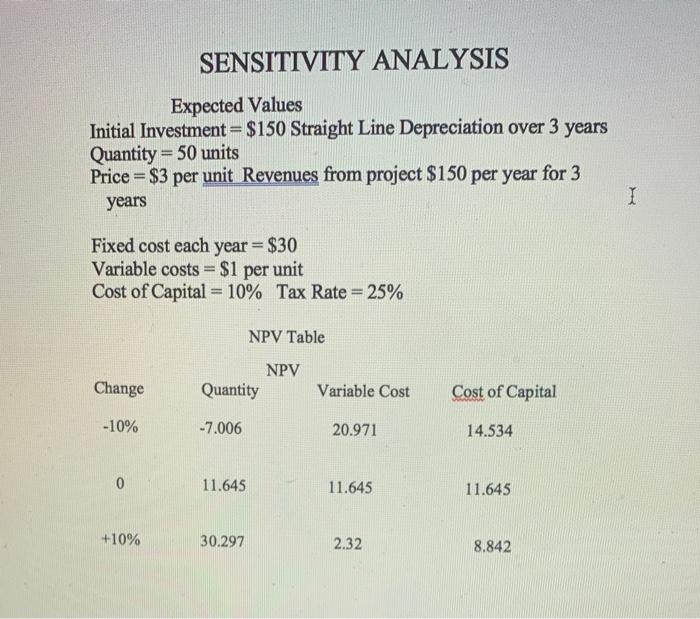
SENSITIVITY ANALYSIS Expected Values Initial Investment = $150 Straight Line Depreciation over 3 years Quantity = 50 units Price = $3 per unit Revenues from project $150 per year for 3 years I Fixed cost each year = $30 Variable costs = $1 per unit Cost of Capital = 10% Tax Rate=25% NPV Table Change NPV Quantity Variable Cost Cost of Capital -10% - 7.006 20.971 14.534 0 11.645 11.645 11.645 +10% 30.297 2.32 8.842
Step by Step Solution
There are 3 Steps involved in it
1 Expert Approved Answer
Step: 1 Unlock

Question Has Been Solved by an Expert!
Get step-by-step solutions from verified subject matter experts
Step: 2 Unlock
Step: 3 Unlock