

Woolard Supplies (a sole proprietorship) has taxable income in 2019 of $240,000 before any depreciation deductions...
Fantastic news! We've Found the answer you've been seeking!
Question:
Transcribed Image Text:
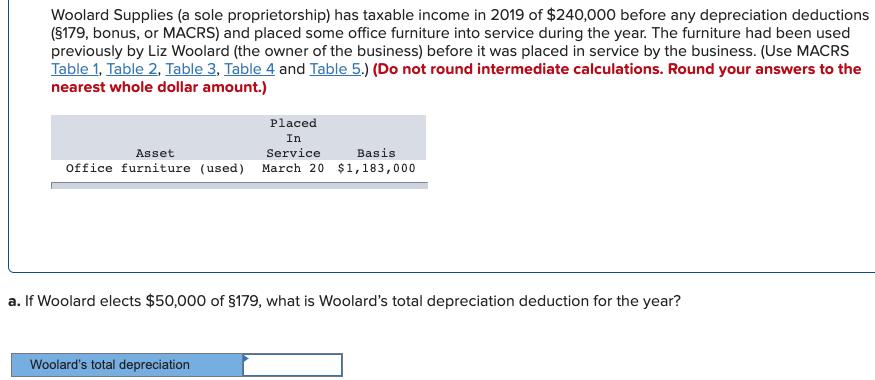
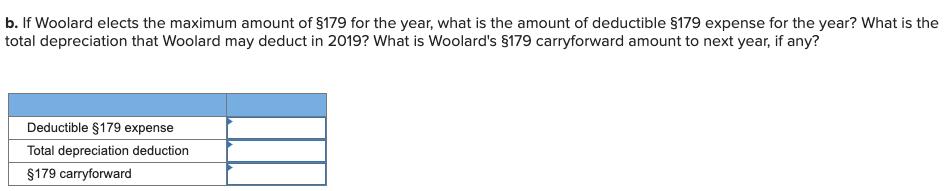
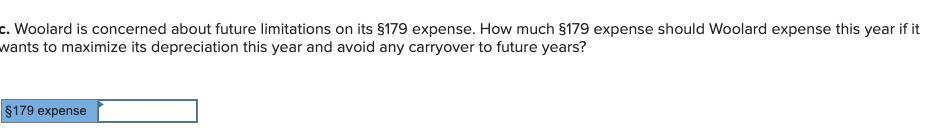
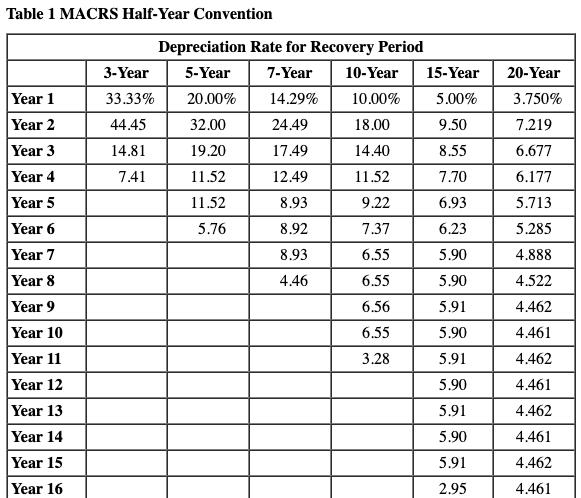
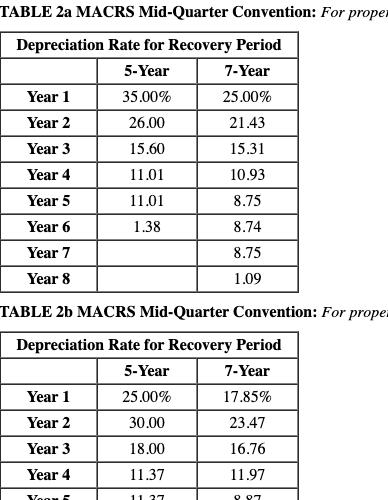
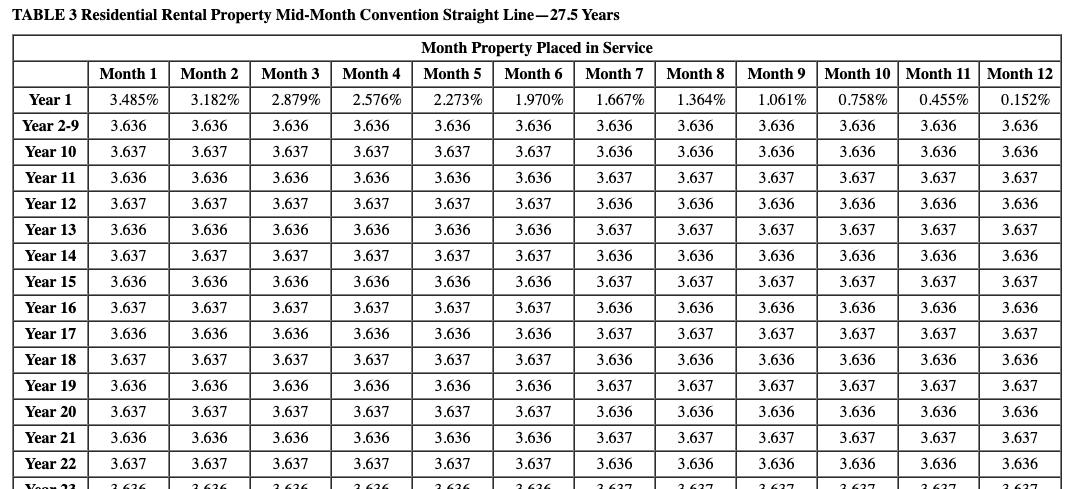
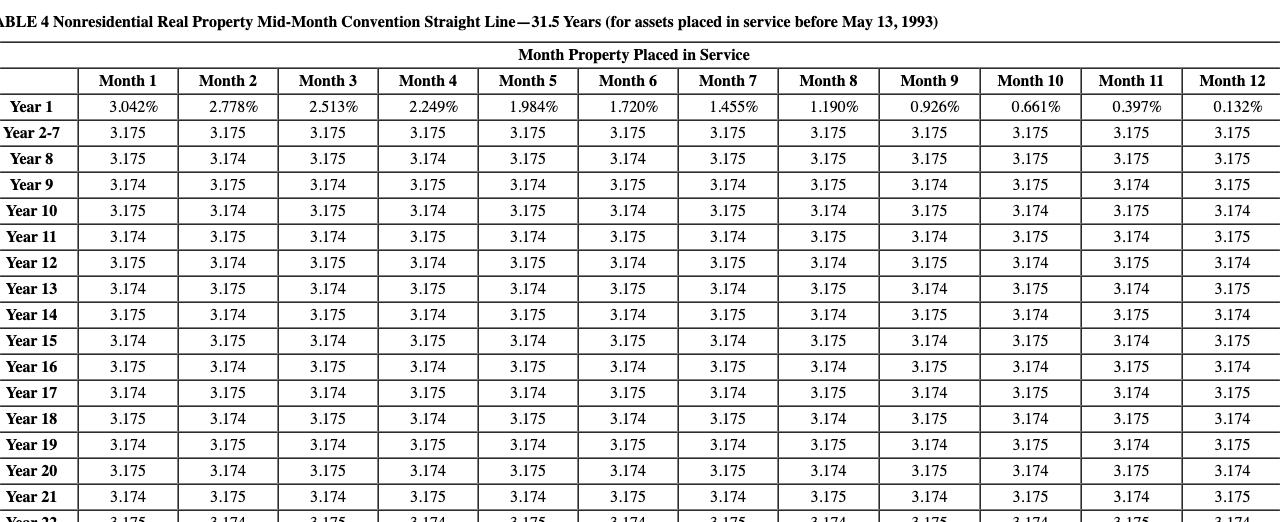
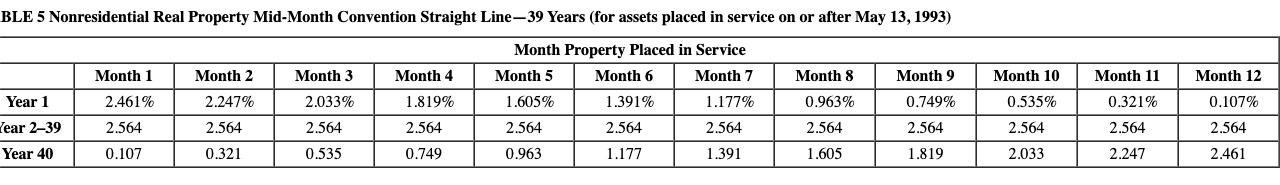
Woolard Supplies (a sole proprietorship) has taxable income in 2019 of $240,000 before any depreciation deductions (5179, bonus, or MACRS) and placed some office furniture into service during the year. The furniture had been used previously by Liz Woolard (the owner of the business) before it was placed in service by the business. (Use MACRS Table 1, Table 2, Table 3, Table 4 and Table 5.) (Do not round intermediate calculations. Round your answers to the nearest whole dollar amount.) Placed In Asset Service Basis Office furniture (used) March 20 $1,183,000 a. If Woolard elects $50,000 of §179, what is Woolard's total depreciation deduction for the year? Woolard's total depreciation b. If Woolard elects the maximum amount of $179 for the year, what is the amount of deductible $179 expense for the year? What is the total depreciation that Woolard may deduct in 2019? What is Woolard's $179 carryforward amount to next year, if any? Deductible $179 expense Total depreciation deduction $179 carryforward c. Woolard is concerned about future limitations on its $179 expense. How much $179 expense should Woolard expense this year if it wants to maximize its depreciation this year and avoid any carryover to future years? $179 expense Table 1 MACRS Half-Year Convention Depreciation Rate for Recovery Period 3-Year 5-Year 7-Year 10-Year 15-Year 20-Year Year 1 Year 2 33.33% 20.00% 14.29% 10.00% 5.00% 3.750% 44.45 32.00 24.49 18.00 9.50 7.219 Year 3 14.81 19.20 17.49 14.40 8.55 6.677 Year 4 7.41 11.52 12.49 11.52 7.70 6.177 Year 5 11.52 8.93 9.22 6.93 5.713 Year 6 Year 7 Year 8 5.76 8.92 7.37 6.23 5.285 8.93 6.55 5.90 4.888 4.46 6.55 5.90 4.522 Year 9 6.56 5.91 4.462 Year 10 Year 11 Year 12 6.55 5.90 4.461 3.28 5.91 4.462 5.90 4.461 Year 13 5.91 4.462 Year 14 5.90 4.461 Year 15 5.91 4.462 Year 16 2.95 4.461 TABLE 2a MACRS Mid-Quarter Convention: For proper Depreciation Rate for Recovery Period 5-Year 7-Year Year 1 35.00% 25.00% Year 2 26.00 21.43 Year 3 15.60 15.31 Year 4 11.01 10.93 Year 5 11.01 8.75 Year 6 1.38 8.74 Year 7 8.75 Year 8 1.09 TABLE 2b MACRS Mid-Quarter Convention: For prope Depreciation Rate for Recovery Period 5-Year 7-Year Year 1 25.00% 17.85% Year 2 30.00 23.47 Year 3 18.00 16.76 Year 4 11.37 11.97 Voom 11. 27 O 07 TABLE 3 Residential Rental Property Mid-Month Convention Straight Line-27.5 Years Month Property Placed in Service Month 1 Month 2 Month 3 Month 4 Month 5 Month 6 Month 7 Month 8 Month 9 Month 10 Month 11 Month 12 Year 1 3.485% 3.182% 2.879% 2.576% 2.273% 1.970% 1.667% 1.364% 1.061% 0.758% 0.455% 0.152% Year 2-9 3.636 3.636 3.636 3.636 3.636 3.636 3.636 3.636 3.636 3.636 3.636 3.636 Year 10 3.637 3.637 3.637 3.637 3.637 3.637 3.636 3.636 3.636 3.636 3.636 3.636 Year 11 3.636 3.636 3.636 3.636 3.636 3.636 3.637 3.637 3.637 3.637 3.637 3.637 Year 12 3.637 3.637 3.637 3.637 3.637 3.637 3.636 3.636 3.636 3.636 3.636 3.636 Year 13 3.636 3.636 3.636 3.636 3.636 3.636 3.637 3.637 3.637 3.637 3.637 3.637 Year 14 3.637 3.637 3.637 3.637 3.637 3.637 3.636 3.636 3.636 3.636 3.636 3.636 Year 15 3.636 3.636 3.636 3.636 3.636 3.636 3.637 3.637 3.637 3.637 3.637 3.637 Year 16 3.637 3.637 3.637 3.637 3.637 3.637 3.636 3.636 3.636 3.636 3.636 3.636 Year 17 3.636 3.636 3.636 3.636 3.636 3.636 3.637 3.637 3.637 3.637 3.637 3.637 Year 18 3.637 3.637 3.637 3.637 3.637 3.637 3.636 3.636 3.636 3.636 3.636 3.636 Year 19 3.636 3.636 3.636 3.636 3.636 3,636 3.637 3.637 3.637 3.637 3.637 3.637 Year 20 3.637 3.637 3.637 3.637 3.637 3.637 3.636 3.636 3.636 3.636 3.636 3.636 Year 21 3.636 3.636 3.636 3.636 3.636 3.636 3.637 3.637 3.637 3.637 3.637 3.637 Year 22 3.637 3.637 3.637 3.637 3.637 3.637 3.636 3.636 3.636 3.636 3.636 3.636 Yoon 13 3 636 1 636 3 636 3 636 3 636 1 636 3 627 1 67 3 627 3 637 3 637 3637 ABLE 4 Nonresidential Real Property Mid-Month Convention Straight Line-31.5 Years (for assets placed in service before May 13, 1993) Month Property Placed in Service Month 1 Month 2 Month 3 Month 4 Month 5 Month 6 Month 7 Month 8 Month 9 Month 10 Month 11 Month 12 Year 1 3.042% 2.778% 2.513% 2.249% 1.984% 1.720% 1.455% 1.190% 0.926% 0.661% 0.397% 0.132% Year 2-7 3.175 3.175 3.175 3.175 3.175 3.175 3.175 3.175 3.175 3.175 3.175 3.175 Year 8 3.175 3.174 3.175 3.174 3.175 3.174 3.175 3.175 3.175 3.175 3.175 3.175 Year 9 3.174 3.175 3.174 3.175 3.174 3.175 3,174 3.175 3.174 3.175 3.174 3.175 Year 10 3.175 3.174 3.175 3.174 3.175 3.174 3.175 3.174 3.175 3.174 3.175 3.174 Year 11 3.174 3.175 3.174 3.175 3.174 3.175 3.174 3.175 3.174 3.175 3.174 3.175 Year 12 3.175 3.174 3.175 3.174 3.175 3.174 3.175 3.174 3.175 3.174 3.175 3.174 Year 13 3.174 3.175 3.174 3.175 3.174 3.175 3.174 3.175 3.174 3.175 3.174 3.175 Year 14 3.175 3.174 3.175 3.174 3.175 3.174 3.175 3.174 3.175 3.174 3.175 3.174 Year 15 3.174 3.175 3.174 3.175 3.174 3.175 3.174 3.175 3.174 3.175 3.174 3.175 Year 16 3.175 3.174 3.175 3.174 3.175 3.174 3.175 3.174 3.175 3.174 3.175 3.174 Year 17 3.174 3.175 3.174 3.175 3.174 3,175 3.174 3.175 3.174 3.175 3.174 3.175 Year 18 3.175 3.174 3.175 3.174 3.175 3.174 3.175 3.174 3.175 3.174 3.175 3.174 Year 19 3.174 3.175 3.174 3.175 3.174 3.175 3.174 3.175 3.174 3.175 3.174 3.175 Year 20 3.175 3.174 3.175 3.174 3.175 3.174 3.175 3.174 3.175 3.174 3.175 3.174 Year 21 3.174 3.175 3.174 3.175 3.174 3.175 3.174 3.175 3.174 3.175 3.174 3.175 Yoou 11 2 175 2 174 1 175 1 174 3 174 1 175 3 174 7 175 2 174 2 175 2 174 2175 BLE 5 Nonresidential Real Property Mid-Month Convention Straight Line-39 Years (for assets placed in service on or after May 13, 1993) Month Property Placed in Service Month 1 Month 2 Month 3 Month 4 Month 5 Month 6 Month 7 Month 8 Month 9 Month 10 Month 11 Month 12 Year 1 2.461% 2.247% 2.033% 1.819% 1.605% 1.391% 1.177% 0.963% 0.749% 0,535% 0.321% 0.107% Tear 2-39 2.564 2.564 2.564 2.564 2.564 2.564 2.564 2.564 2.564 2.564 2.564 2.564 Year 40 0.107 0.321 0.535 0.749 0.963 1.177 1.391 1.605 1.819 2.033 2.247 2.461 Woolard Supplies (a sole proprietorship) has taxable income in 2019 of $240,000 before any depreciation deductions (5179, bonus, or MACRS) and placed some office furniture into service during the year. The furniture had been used previously by Liz Woolard (the owner of the business) before it was placed in service by the business. (Use MACRS Table 1, Table 2, Table 3, Table 4 and Table 5.) (Do not round intermediate calculations. Round your answers to the nearest whole dollar amount.) Placed In Asset Service Basis Office furniture (used) March 20 $1,183,000 a. If Woolard elects $50,000 of §179, what is Woolard's total depreciation deduction for the year? Woolard's total depreciation b. If Woolard elects the maximum amount of $179 for the year, what is the amount of deductible $179 expense for the year? What is the total depreciation that Woolard may deduct in 2019? What is Woolard's $179 carryforward amount to next year, if any? Deductible $179 expense Total depreciation deduction $179 carryforward c. Woolard is concerned about future limitations on its $179 expense. How much $179 expense should Woolard expense this year if it wants to maximize its depreciation this year and avoid any carryover to future years? $179 expense Table 1 MACRS Half-Year Convention Depreciation Rate for Recovery Period 3-Year 5-Year 7-Year 10-Year 15-Year 20-Year Year 1 Year 2 33.33% 20.00% 14.29% 10.00% 5.00% 3.750% 44.45 32.00 24.49 18.00 9.50 7.219 Year 3 14.81 19.20 17.49 14.40 8.55 6.677 Year 4 7.41 11.52 12.49 11.52 7.70 6.177 Year 5 11.52 8.93 9.22 6.93 5.713 Year 6 Year 7 Year 8 5.76 8.92 7.37 6.23 5.285 8.93 6.55 5.90 4.888 4.46 6.55 5.90 4.522 Year 9 6.56 5.91 4.462 Year 10 Year 11 Year 12 6.55 5.90 4.461 3.28 5.91 4.462 5.90 4.461 Year 13 5.91 4.462 Year 14 5.90 4.461 Year 15 5.91 4.462 Year 16 2.95 4.461 TABLE 2a MACRS Mid-Quarter Convention: For proper Depreciation Rate for Recovery Period 5-Year 7-Year Year 1 35.00% 25.00% Year 2 26.00 21.43 Year 3 15.60 15.31 Year 4 11.01 10.93 Year 5 11.01 8.75 Year 6 1.38 8.74 Year 7 8.75 Year 8 1.09 TABLE 2b MACRS Mid-Quarter Convention: For prope Depreciation Rate for Recovery Period 5-Year 7-Year Year 1 25.00% 17.85% Year 2 30.00 23.47 Year 3 18.00 16.76 Year 4 11.37 11.97 Voom 11. 27 O 07 TABLE 3 Residential Rental Property Mid-Month Convention Straight Line-27.5 Years Month Property Placed in Service Month 1 Month 2 Month 3 Month 4 Month 5 Month 6 Month 7 Month 8 Month 9 Month 10 Month 11 Month 12 Year 1 3.485% 3.182% 2.879% 2.576% 2.273% 1.970% 1.667% 1.364% 1.061% 0.758% 0.455% 0.152% Year 2-9 3.636 3.636 3.636 3.636 3.636 3.636 3.636 3.636 3.636 3.636 3.636 3.636 Year 10 3.637 3.637 3.637 3.637 3.637 3.637 3.636 3.636 3.636 3.636 3.636 3.636 Year 11 3.636 3.636 3.636 3.636 3.636 3.636 3.637 3.637 3.637 3.637 3.637 3.637 Year 12 3.637 3.637 3.637 3.637 3.637 3.637 3.636 3.636 3.636 3.636 3.636 3.636 Year 13 3.636 3.636 3.636 3.636 3.636 3.636 3.637 3.637 3.637 3.637 3.637 3.637 Year 14 3.637 3.637 3.637 3.637 3.637 3.637 3.636 3.636 3.636 3.636 3.636 3.636 Year 15 3.636 3.636 3.636 3.636 3.636 3.636 3.637 3.637 3.637 3.637 3.637 3.637 Year 16 3.637 3.637 3.637 3.637 3.637 3.637 3.636 3.636 3.636 3.636 3.636 3.636 Year 17 3.636 3.636 3.636 3.636 3.636 3.636 3.637 3.637 3.637 3.637 3.637 3.637 Year 18 3.637 3.637 3.637 3.637 3.637 3.637 3.636 3.636 3.636 3.636 3.636 3.636 Year 19 3.636 3.636 3.636 3.636 3.636 3,636 3.637 3.637 3.637 3.637 3.637 3.637 Year 20 3.637 3.637 3.637 3.637 3.637 3.637 3.636 3.636 3.636 3.636 3.636 3.636 Year 21 3.636 3.636 3.636 3.636 3.636 3.636 3.637 3.637 3.637 3.637 3.637 3.637 Year 22 3.637 3.637 3.637 3.637 3.637 3.637 3.636 3.636 3.636 3.636 3.636 3.636 Yoon 13 3 636 1 636 3 636 3 636 3 636 1 636 3 627 1 67 3 627 3 637 3 637 3637 ABLE 4 Nonresidential Real Property Mid-Month Convention Straight Line-31.5 Years (for assets placed in service before May 13, 1993) Month Property Placed in Service Month 1 Month 2 Month 3 Month 4 Month 5 Month 6 Month 7 Month 8 Month 9 Month 10 Month 11 Month 12 Year 1 3.042% 2.778% 2.513% 2.249% 1.984% 1.720% 1.455% 1.190% 0.926% 0.661% 0.397% 0.132% Year 2-7 3.175 3.175 3.175 3.175 3.175 3.175 3.175 3.175 3.175 3.175 3.175 3.175 Year 8 3.175 3.174 3.175 3.174 3.175 3.174 3.175 3.175 3.175 3.175 3.175 3.175 Year 9 3.174 3.175 3.174 3.175 3.174 3.175 3,174 3.175 3.174 3.175 3.174 3.175 Year 10 3.175 3.174 3.175 3.174 3.175 3.174 3.175 3.174 3.175 3.174 3.175 3.174 Year 11 3.174 3.175 3.174 3.175 3.174 3.175 3.174 3.175 3.174 3.175 3.174 3.175 Year 12 3.175 3.174 3.175 3.174 3.175 3.174 3.175 3.174 3.175 3.174 3.175 3.174 Year 13 3.174 3.175 3.174 3.175 3.174 3.175 3.174 3.175 3.174 3.175 3.174 3.175 Year 14 3.175 3.174 3.175 3.174 3.175 3.174 3.175 3.174 3.175 3.174 3.175 3.174 Year 15 3.174 3.175 3.174 3.175 3.174 3.175 3.174 3.175 3.174 3.175 3.174 3.175 Year 16 3.175 3.174 3.175 3.174 3.175 3.174 3.175 3.174 3.175 3.174 3.175 3.174 Year 17 3.174 3.175 3.174 3.175 3.174 3,175 3.174 3.175 3.174 3.175 3.174 3.175 Year 18 3.175 3.174 3.175 3.174 3.175 3.174 3.175 3.174 3.175 3.174 3.175 3.174 Year 19 3.174 3.175 3.174 3.175 3.174 3.175 3.174 3.175 3.174 3.175 3.174 3.175 Year 20 3.175 3.174 3.175 3.174 3.175 3.174 3.175 3.174 3.175 3.174 3.175 3.174 Year 21 3.174 3.175 3.174 3.175 3.174 3.175 3.174 3.175 3.174 3.175 3.174 3.175 Yoou 11 2 175 2 174 1 175 1 174 3 174 1 175 3 174 7 175 2 174 2 175 2 174 2175 BLE 5 Nonresidential Real Property Mid-Month Convention Straight Line-39 Years (for assets placed in service on or after May 13, 1993) Month Property Placed in Service Month 1 Month 2 Month 3 Month 4 Month 5 Month 6 Month 7 Month 8 Month 9 Month 10 Month 11 Month 12 Year 1 2.461% 2.247% 2.033% 1.819% 1.605% 1.391% 1.177% 0.963% 0.749% 0,535% 0.321% 0.107% Tear 2-39 2.564 2.564 2.564 2.564 2.564 2.564 2.564 2.564 2.564 2.564 2.564 2.564 Year 40 0.107 0.321 0.535 0.749 0.963 1.177 1.391 1.605 1.819 2.033 2.247 2.461
Expert Answer:

Related Book For 

Essentials of Federal Taxation 2019
ISBN: 9781260190045
10th edition
Authors: Brian Spilker, Benjamin Ayers, John Robinson, Edmund Outslay, Ronald Worsham, John Barrick, Connie Weaver
Posted Date:
Students also viewed these accounting questions
-
Woolard Supplies (a sole proprietorship) has taxable income in 2018 of $240,000 before any depreciation deductions (§179, bonus, or MACRS) and placed some office furniture into service during...
-
For the beam and loading shown, design the cross section of the beam, knowing that the grade of timber used has an allowable normal stress of 16 MPa. B 90 kN/m 3.2 m A d= mm X
-
Woolard Inc. has taxable income in 2014of $150,000 before any depreciation deductions (179, bonus, or MACRS) and acquired the following assets during the year: Asset ................................
-
The insurance company Helmet is considering acquiring BeSafe, a life insurance company. According to BeSafes most recent financial statements, its loss ratio stands at 0.9, and its expense ratio...
-
If A and B are vectors specified in magnitude-direction form, and C = A + B is to be found and to be expressed in magnitude-direction form, how is this done? That is, what is the procedure for adding...
-
An automated storage/retrieval system has four aisles. The storage racks in each aisle are 40 ft high and 200 ft long. The S/R machine for each aisle travels at a horizontal speed of 400 ft/min and a...
-
Explain the difference between design, analysis, and patterns.
-
In this exercise, you will complete the Property Tax application that you created in Exercise 3 in Chapter 2. a. Use Windows to copy the Tax Solution folder from the VB2017\Chap02 folder to the...
-
You are given that xp0 = 1 - ( x /105)2, 0 x 105. What is the probability of (25) dies between ages 54 and 55 OR survives to at least age 55?
-
Use the superposition principle to find io and vo in the circuit Fig. 4.79? Figure 4.79 For Prob. 4.11. 10 10 20 6 A 40 4 +30 V 10
-
If I is a unit matrix of order 10, then the determinant of I is equal to (a) 10 (c) 1/10 (b) 1 (d) 9
-
Assume all risks involved in this question are idiosyncratic (firm-specific) so investors' discount rate is always the risk-free rate, 10%. A firm currently has two assets: $60 million cash and a...
-
1. Calculate reactions at the external supports. 2. Draw the free body diagram. 3. Build the diagrams if shear force and bending moment. (use the section method) 4. Find the diameter of section of...
-
An employee who works for you confronts you with a formal grievance concerning another employee being promoted over him. What initial actions will you take in order to address this grievance?Explain
-
You have a long term donor who is interested in investing 25,000 dollars and has some stipulations on how the money is allocated and request that funding specifically goes to Christian based schools...
-
We can model a trebuchet as a simple system of three masses on two linkages as shown in the sche- matic below. We will assume that the Trebuchet is already built and has a throwing arm that is 15 Im...
-
Use the information in the adjusted trial balance presented below to calculate current assets for Wicked Wicker Company: Account Title Cash Accounts receivable Prepaid insurance Equipment Accumulated...
-
(a) How far away can a human eye distinguish two ear headlights 2.0 m apart? Consider only diffraction effects and assume an eye pupil diameter of 5.0 mm and a wavelength of 550 nm. (b) What is the...
-
Timo is the sole owner of Jazz Inc., an S corporation. On October 31, 2018, Timo executed an unsecured demand promissory note of $15,000 and transferred the note to Jazz (Jazz could require Timo to...
-
Last year, Miley decided to terminate the S corporation election of her solely owned corporation on October 17, 2017 (effective immediately), in preparation for taking it public. At the time of the...
-
Assume that TDW Corporation (calendar-year-end) has 2018 taxable income of $650,000 for purposes of computing the §179 expense. The company acquired the following assets during 2018: a. What is...
-
Describe which characteristics of HR metrics and workforce analytics are likely to result in greater return on investment and organizational impact.
-
Why are information security and privacy important considerations in the design, development, and maintenance of an HRIS?
-
List and discuss the major information security and privacy threats to organizations.

Study smarter with the SolutionInn App