

Question: Word File Edit View Insert Format Tools Table Window Help Q 8 Thu Apr 27 5:16:30 PM AutoSave OFF A ACG ... MGT 451 MOD
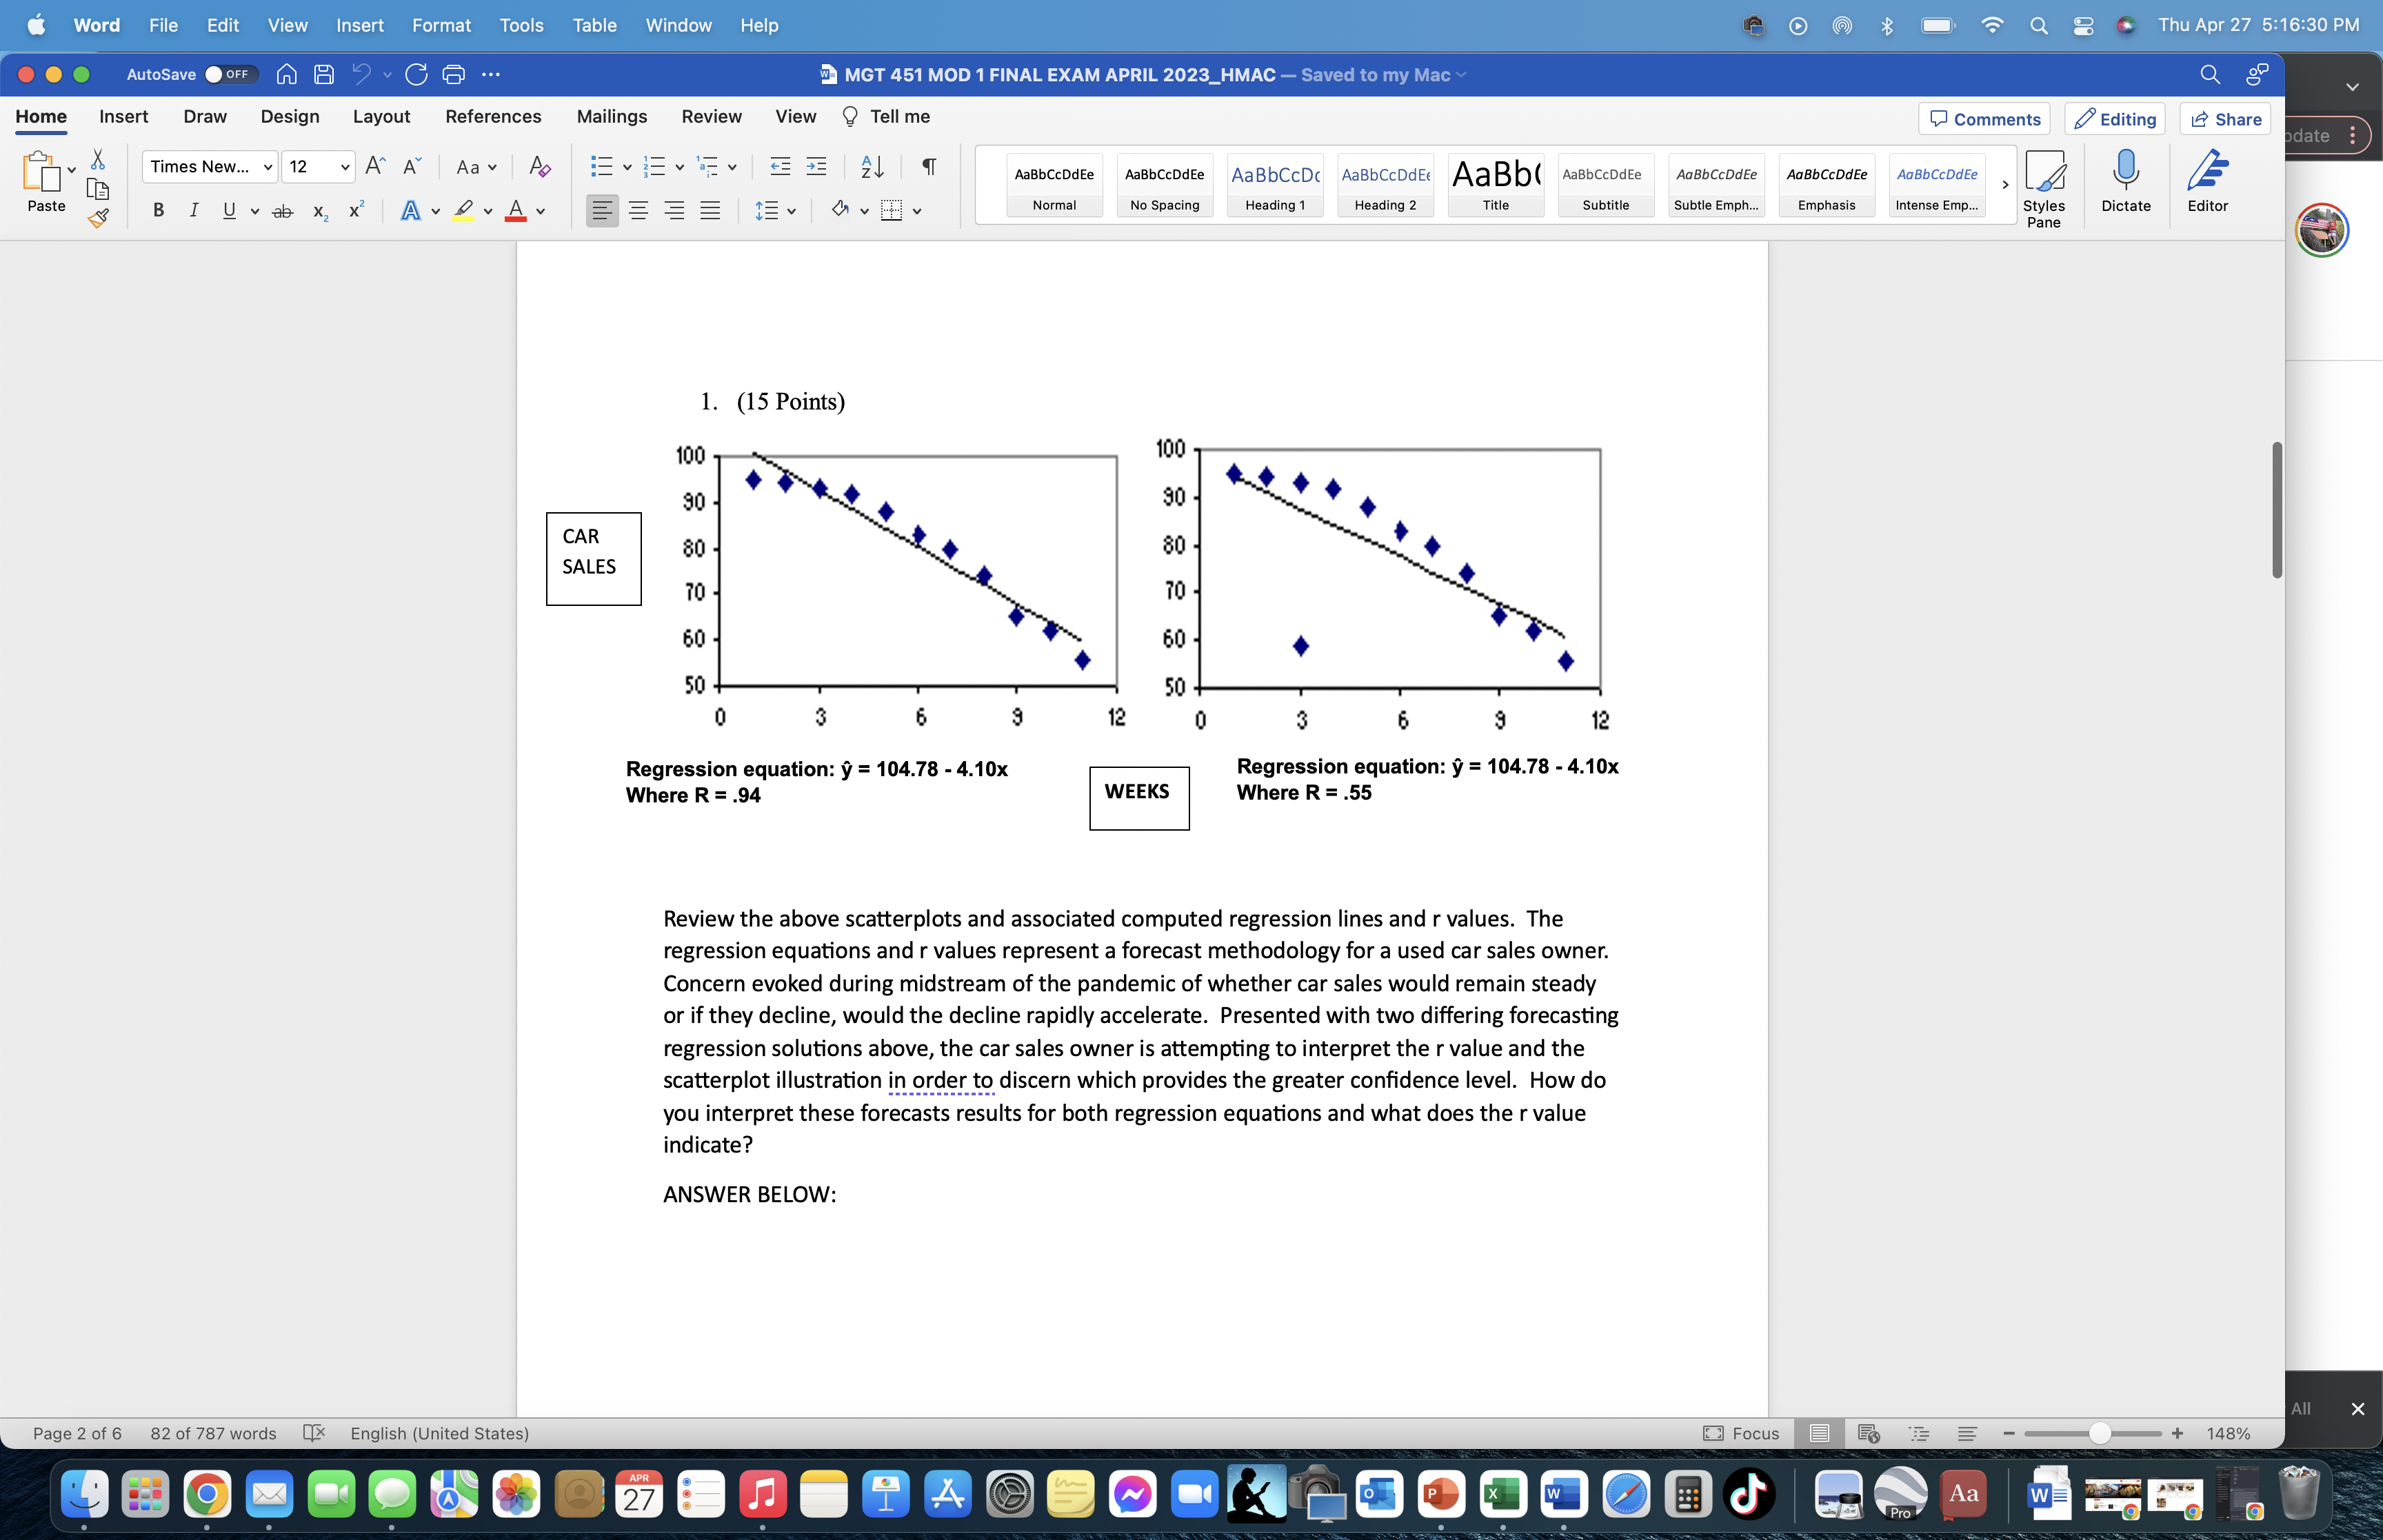
Word File Edit View Insert Format Tools Table Window Help Q 8 Thu Apr 27 5:16:30 PM AutoSave OFF A ACG ... MGT 451 MOD 1 FINAL EXAM APRIL 2023_HMAC - Saved to my Mac go Home Insert Draw Design Layout References Mailings Review View ? Tell me Comments Editing Share date : Times New... v 12 VA A Aa Ap EVENEEVEE 21 AaBbCcDdEe AaBbCcDdEe AaBbCcDc AaBbCcDdE AaBb( AaBbCcDdEe AaBbCcDdEe Aa BbCcDdEe AaBbCcDdEe Paste BIUab x X|A DAY Norma No Spacing Heading 1 Heading 2 Title Subtitle Subtle Emph Emphasis Intense Emp... Styles Dictate Editor pane 1. (15 Points) 100 100 30 90 CAR 30 80 SALES 70 70 60 60 50 50 3 6 3 12 Regression equation: y = 104.78 - 4.10x Regression equation: y = 104.78 - 4.10x Where R = .94 WEEKS Where R = .55 Review the above scatterplots and associated computed regression lines and r values. The regression equations and r values represent a forecast methodology for a used car sales owner. Concern evoked during midstream of the pandemic of whether car sales would remain steady or if they decline, would the decline rapidly accelerate. Presented with two differing forecasting regression solutions above, the car sales owner is attempting to interpret the r value and the scatterplot illustration in order to discern which provides the greater confidence level. How do you interpret these forecasts results for both regression equations and what does the r value indicate? ANSWER BELOW: All X Page 2 of 6 82 of 787 words X English (United States) Focus = = - + 148% O APR 27 4 Aa WE
Step by Step Solution
There are 3 Steps involved in it

Get step-by-step solutions from verified subject matter experts