

Question: work both part (a) and (b) fully in details please. Thanks. Will give a good rating. a) Consider table 1.1 and table 1.2 respectively for
work both part (a) and (b) fully in details please. Thanks. Will give a good rating.
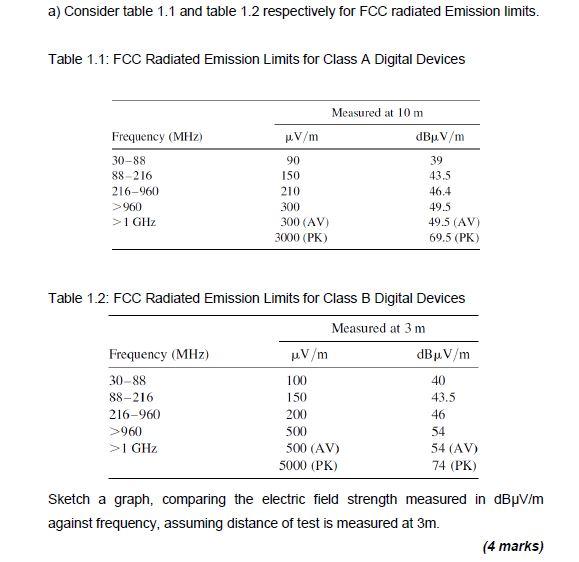
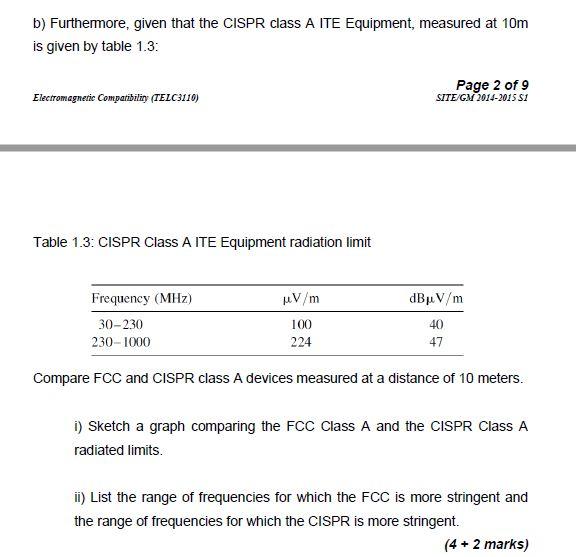
a) Consider table 1.1 and table 1.2 respectively for FCC radiated Emission limits. Table 1.1: FCC Radiated Emission Limits for Class A Digital Devices Table 1.2: FCC Radiated Emission Limits for Class B Digital Devices Sketch a graph, comparing the electric field strength measured in dBV/m against frequency, assuming distance of test is measured at 3m. b) Furthermore, given that the CISPR class A ITE Equipment, measured at 10m is given by table 1.3 : PlectromagneticCompatibiliay(TELCG110)SITEGM2014-201SSIPage2of9 Table 1.3: CISPR Class A ITE Equipment radiation limit Compare FCC and CISPR class A devices measured at a distance of 10 meters. i) Sketch a graph comparing the FCC Class A and the CISPR Class A radiated limits. ii) List the range of frequencies for which the FCC is more stringent and the range of frequencies for which the CISPR is more stringent. (4+2marks)
Step by Step Solution
There are 3 Steps involved in it

Get step-by-step solutions from verified subject matter experts