

Question: Work must be shown in excel using formulas. T Bartlett would like to know how her portfolio is doing. Use the information shown in the
Work must be shown in excel using formulas.
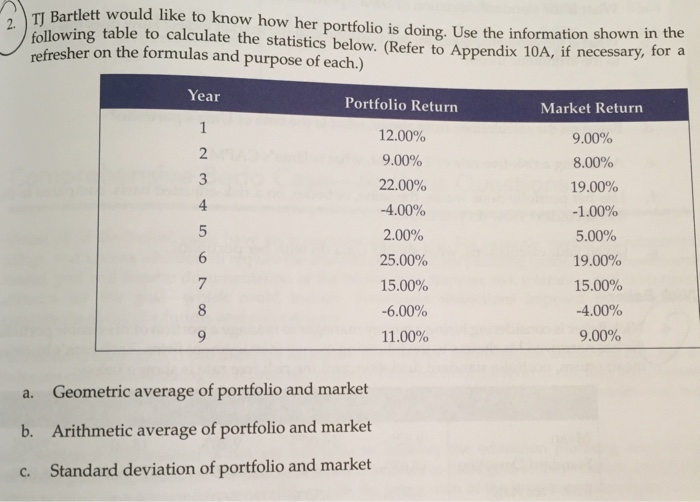
T Bartlett would like to know how her portfolio is doing. Use the information shown in the 2. following table to calculate the statistics below. (Refer to Appendix 10A, if necessary, for a refresher on the formulas and purpose of each.) Year Portfolio Returrn Market Return 900% 8.00% 19.00% -1.00% 5.00% 19.00% 15.00% -4.00% 12.00% 2 22.00% 4 -4.00% 25.00% 15.00% -6.00% 11.00% Geometric average of portfolio and market Arithmetic average of portfolio and market Standard deviation of portfolio and market a. b. c
Step by Step Solution
There are 3 Steps involved in it
1 Expert Approved Answer
Step: 1 Unlock

Question Has Been Solved by an Expert!
Get step-by-step solutions from verified subject matter experts
Step: 2 Unlock
Step: 3 Unlock