

Question: Work.aspx:homeworkId=6428357 7 68 questionld = 1&flushed =false& cld = 7 2746058( * E d Economics MWF 1:00-1:50 Solomon Starks Jr. 02/20/23 8:49 PM Solomon ion
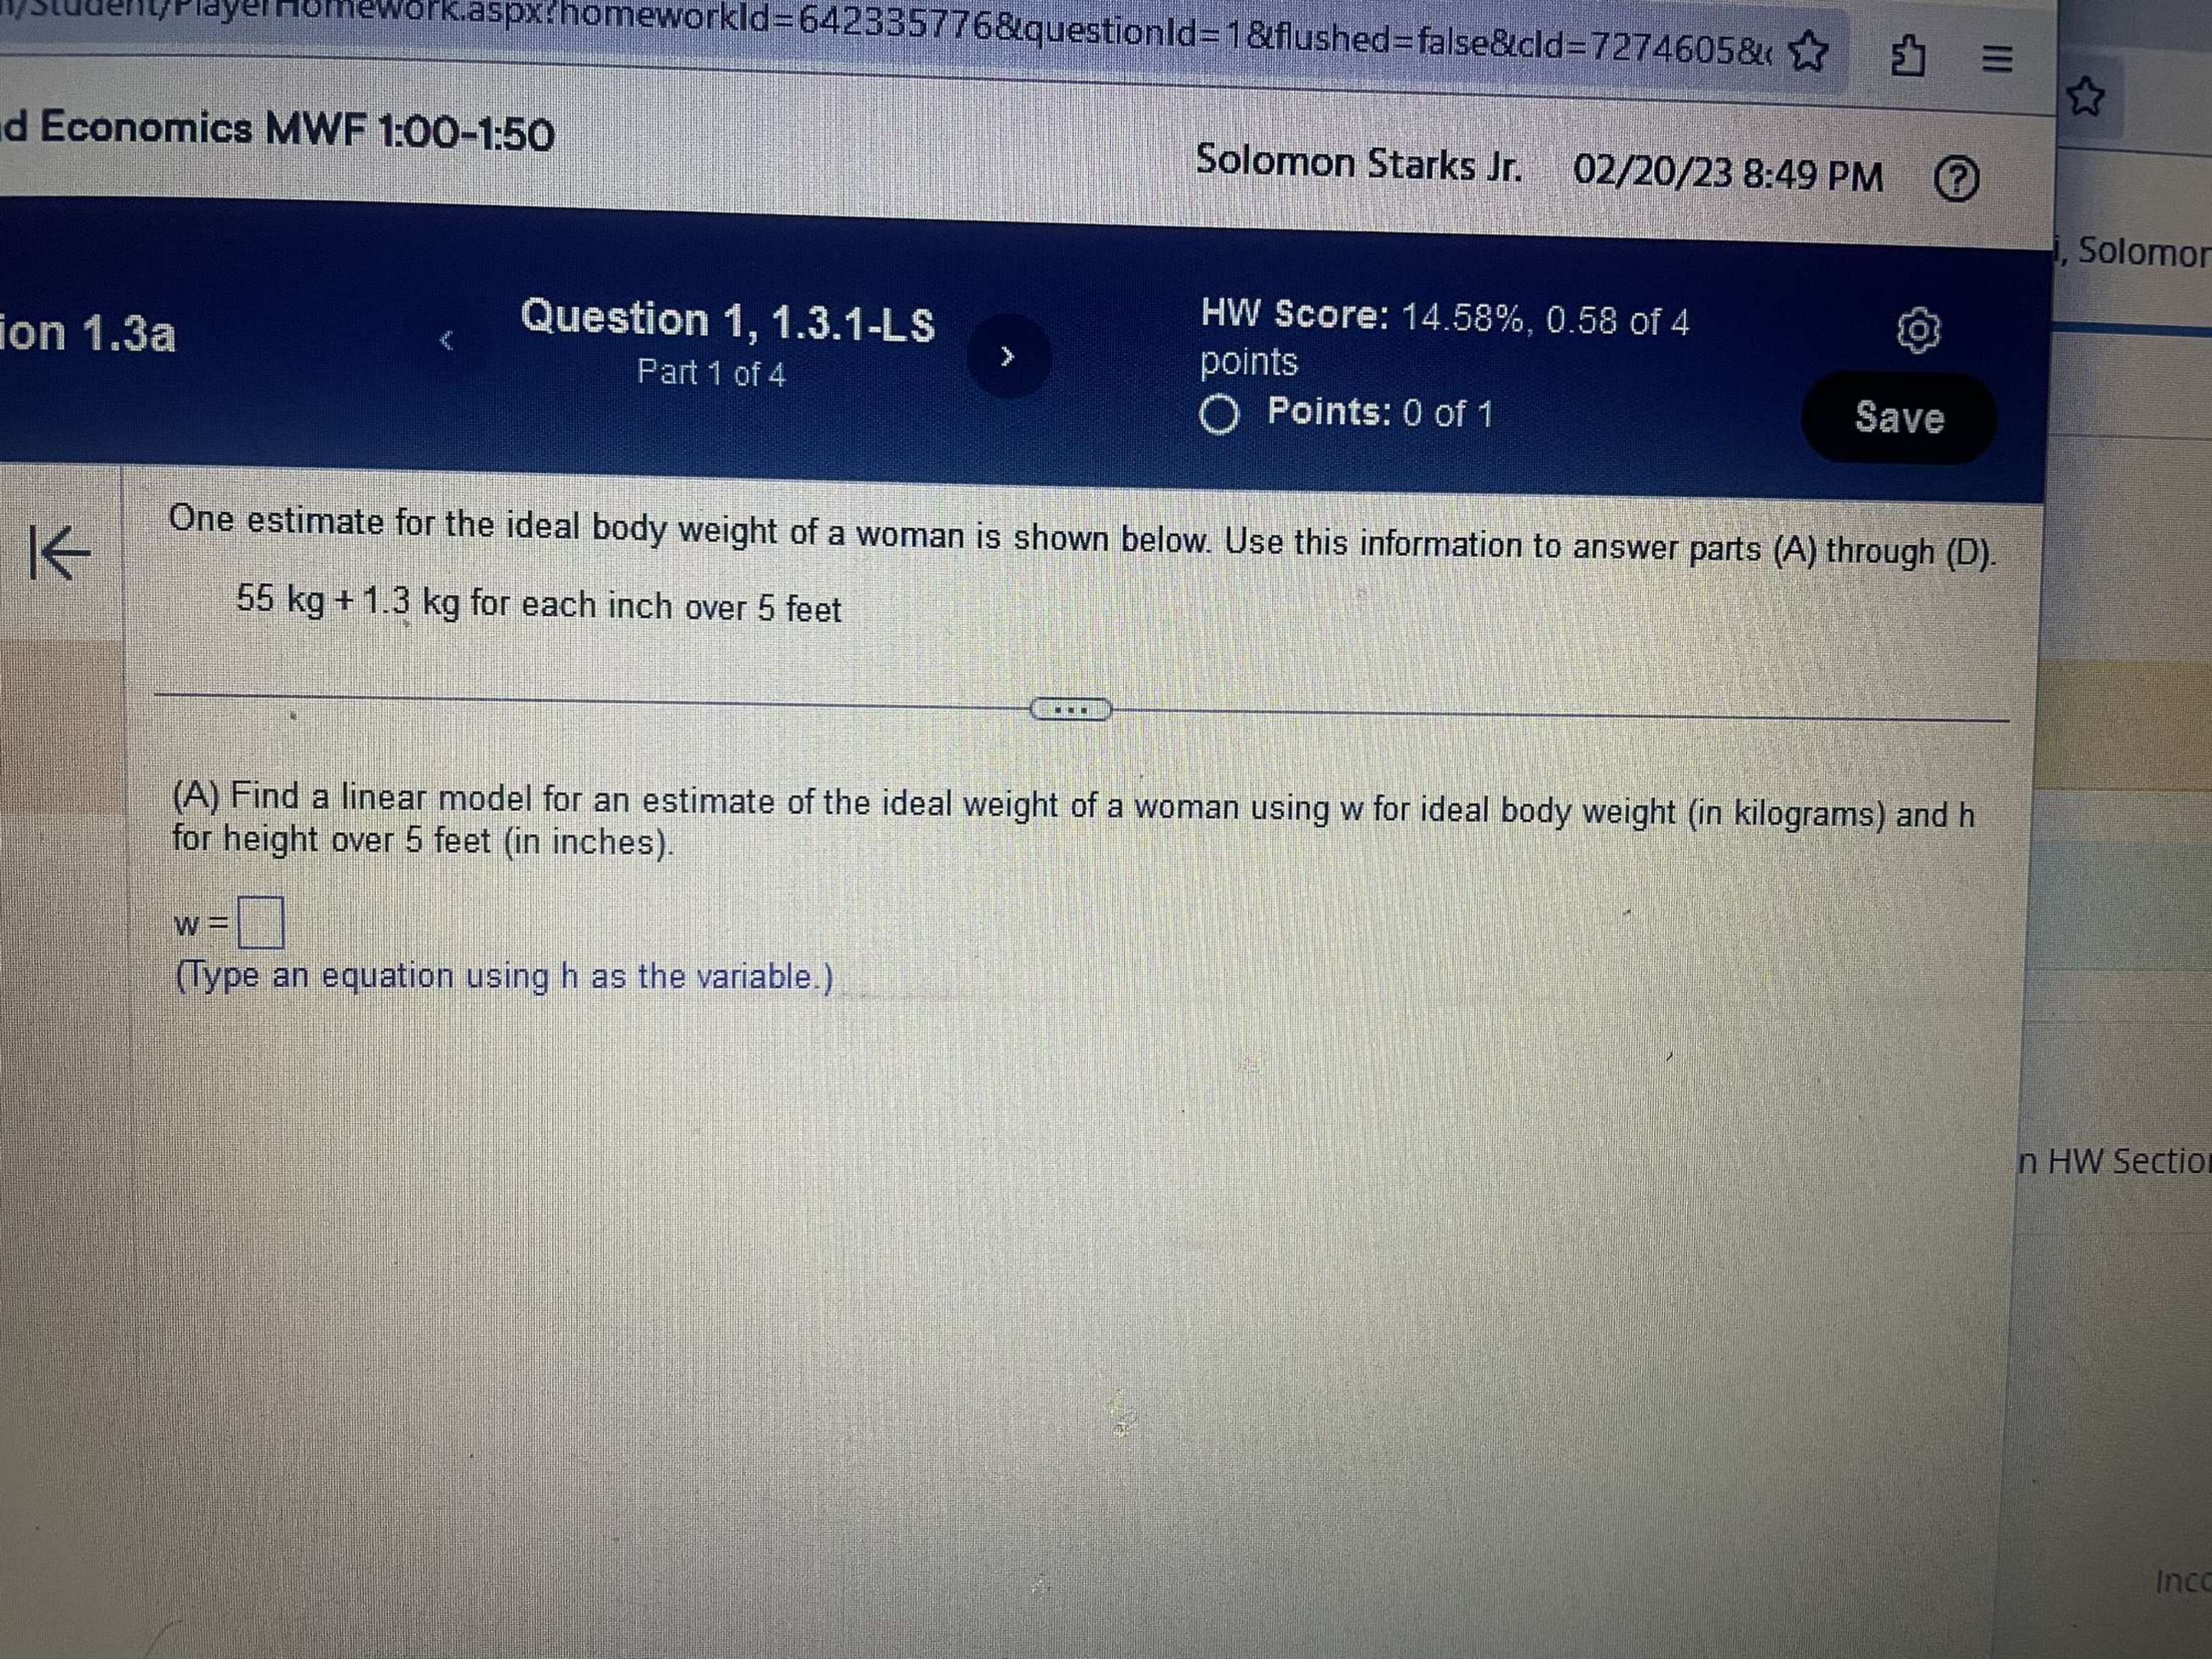
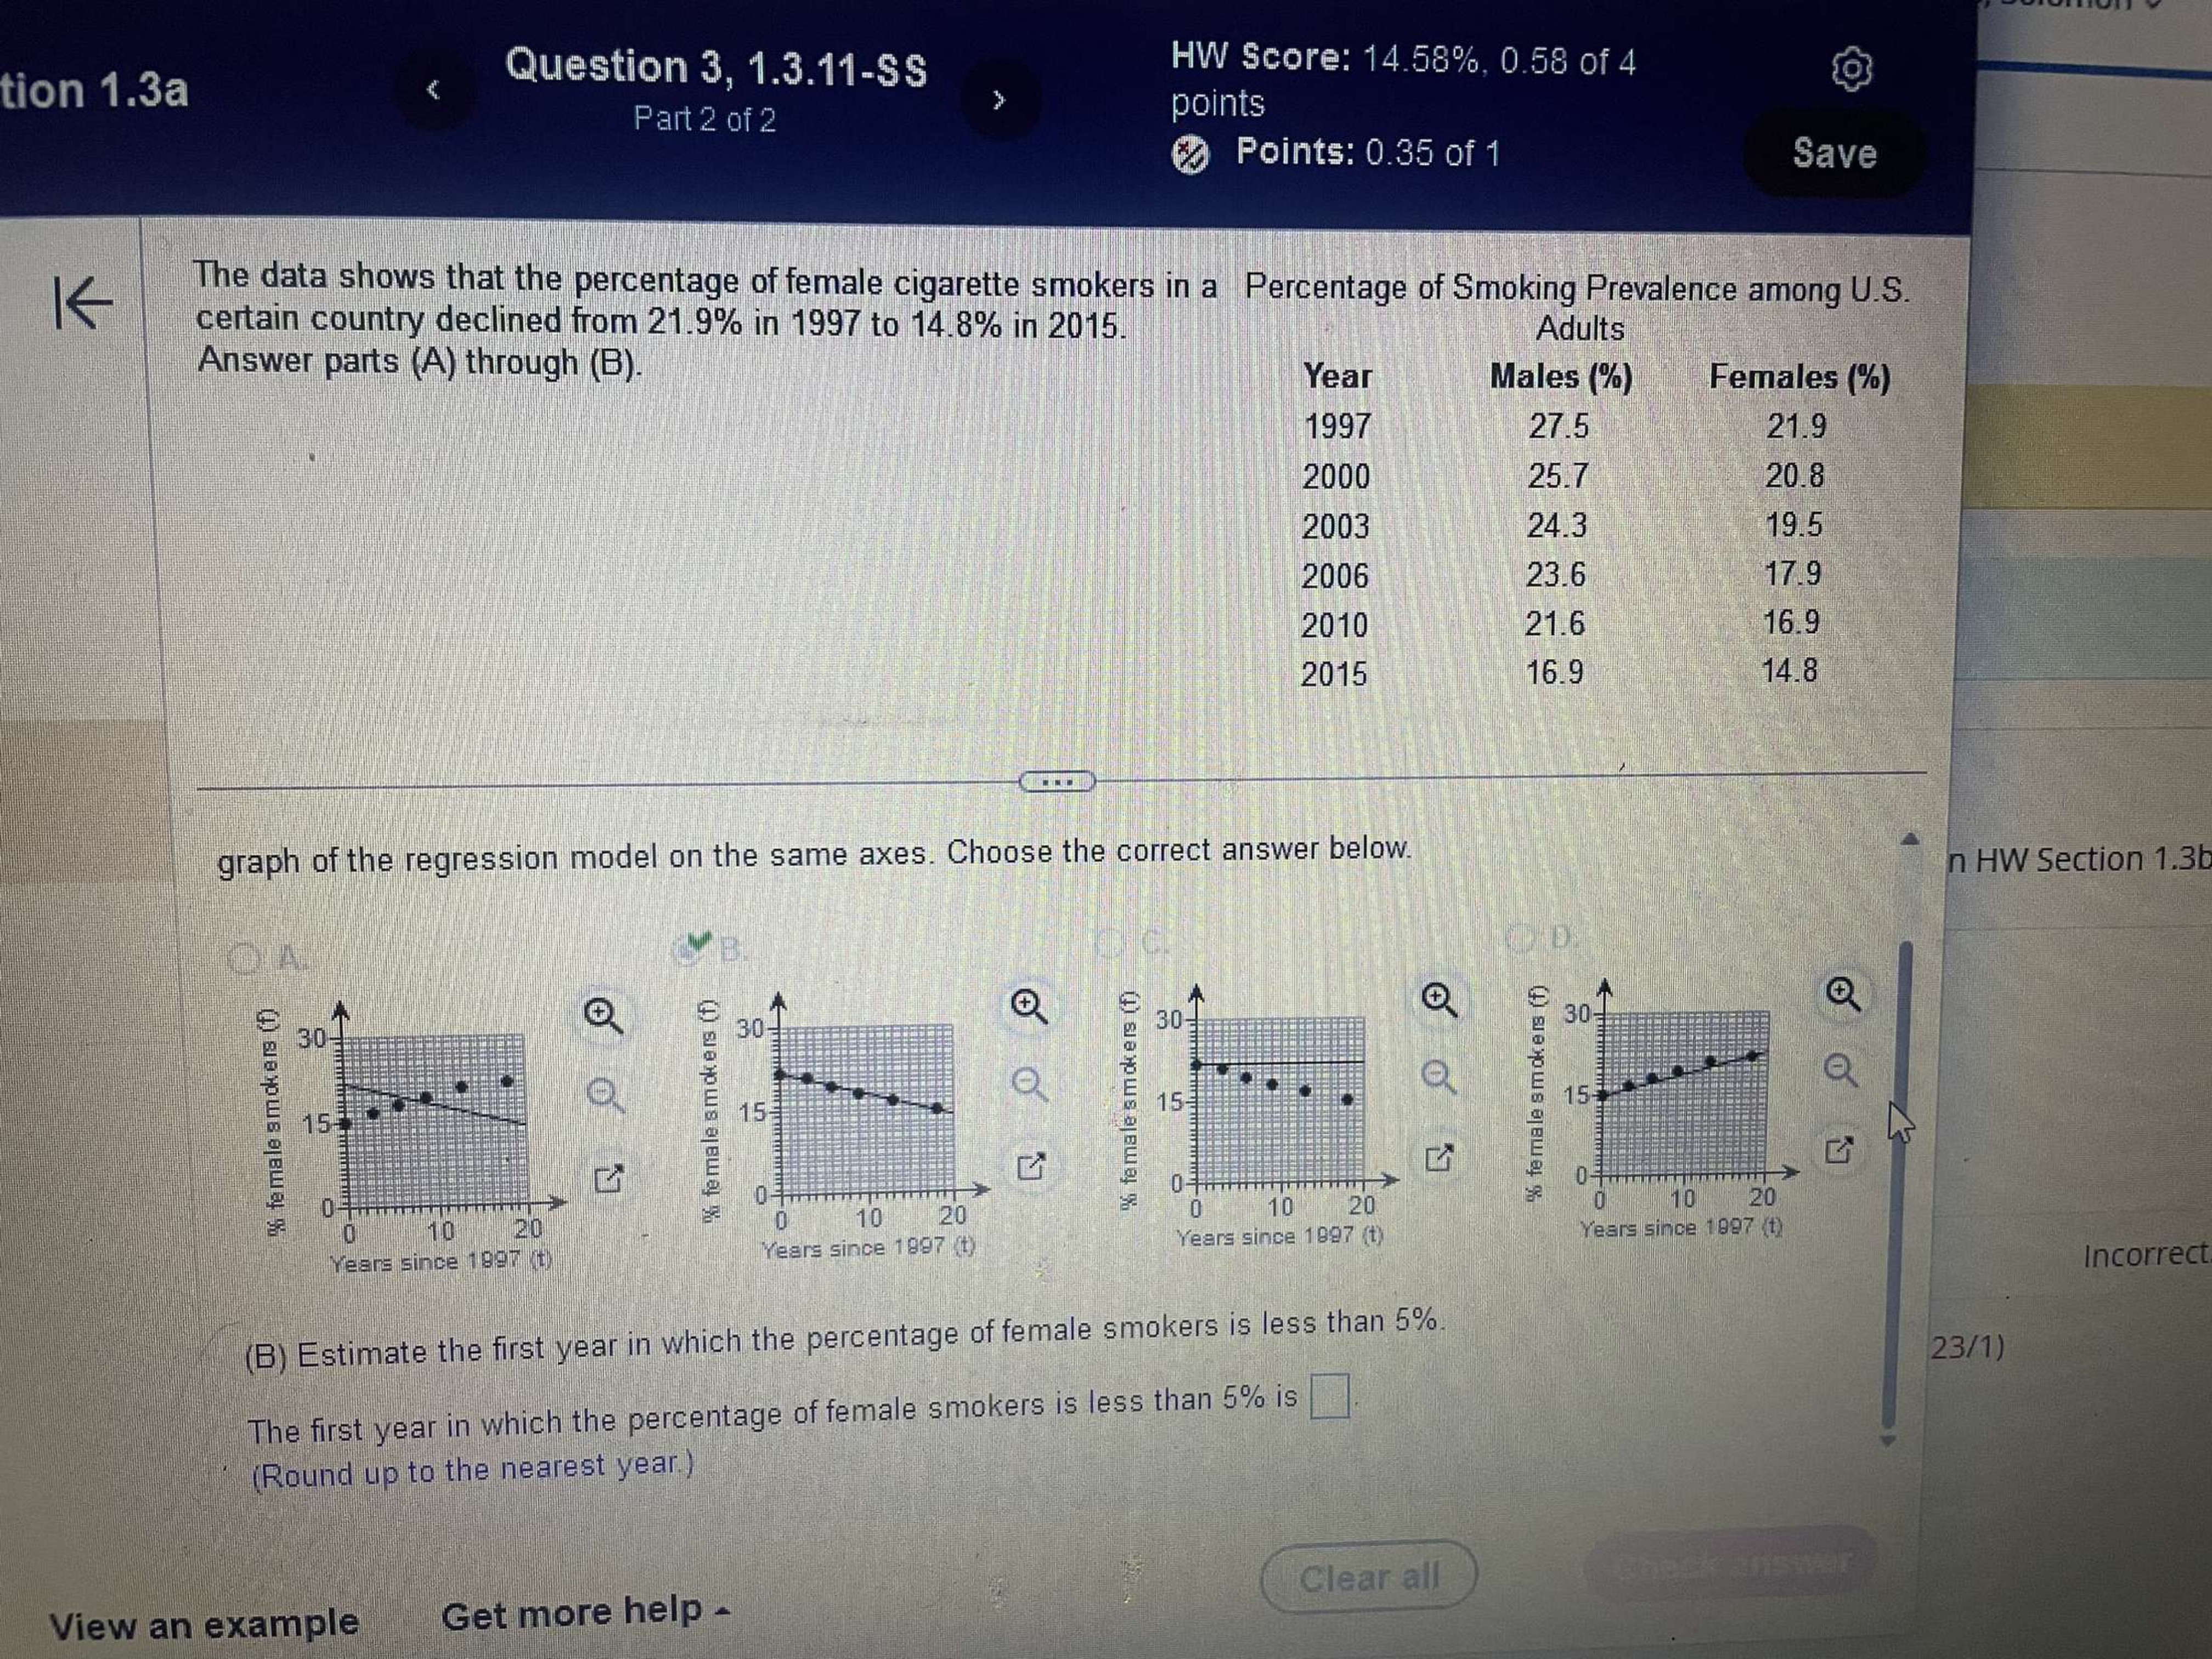
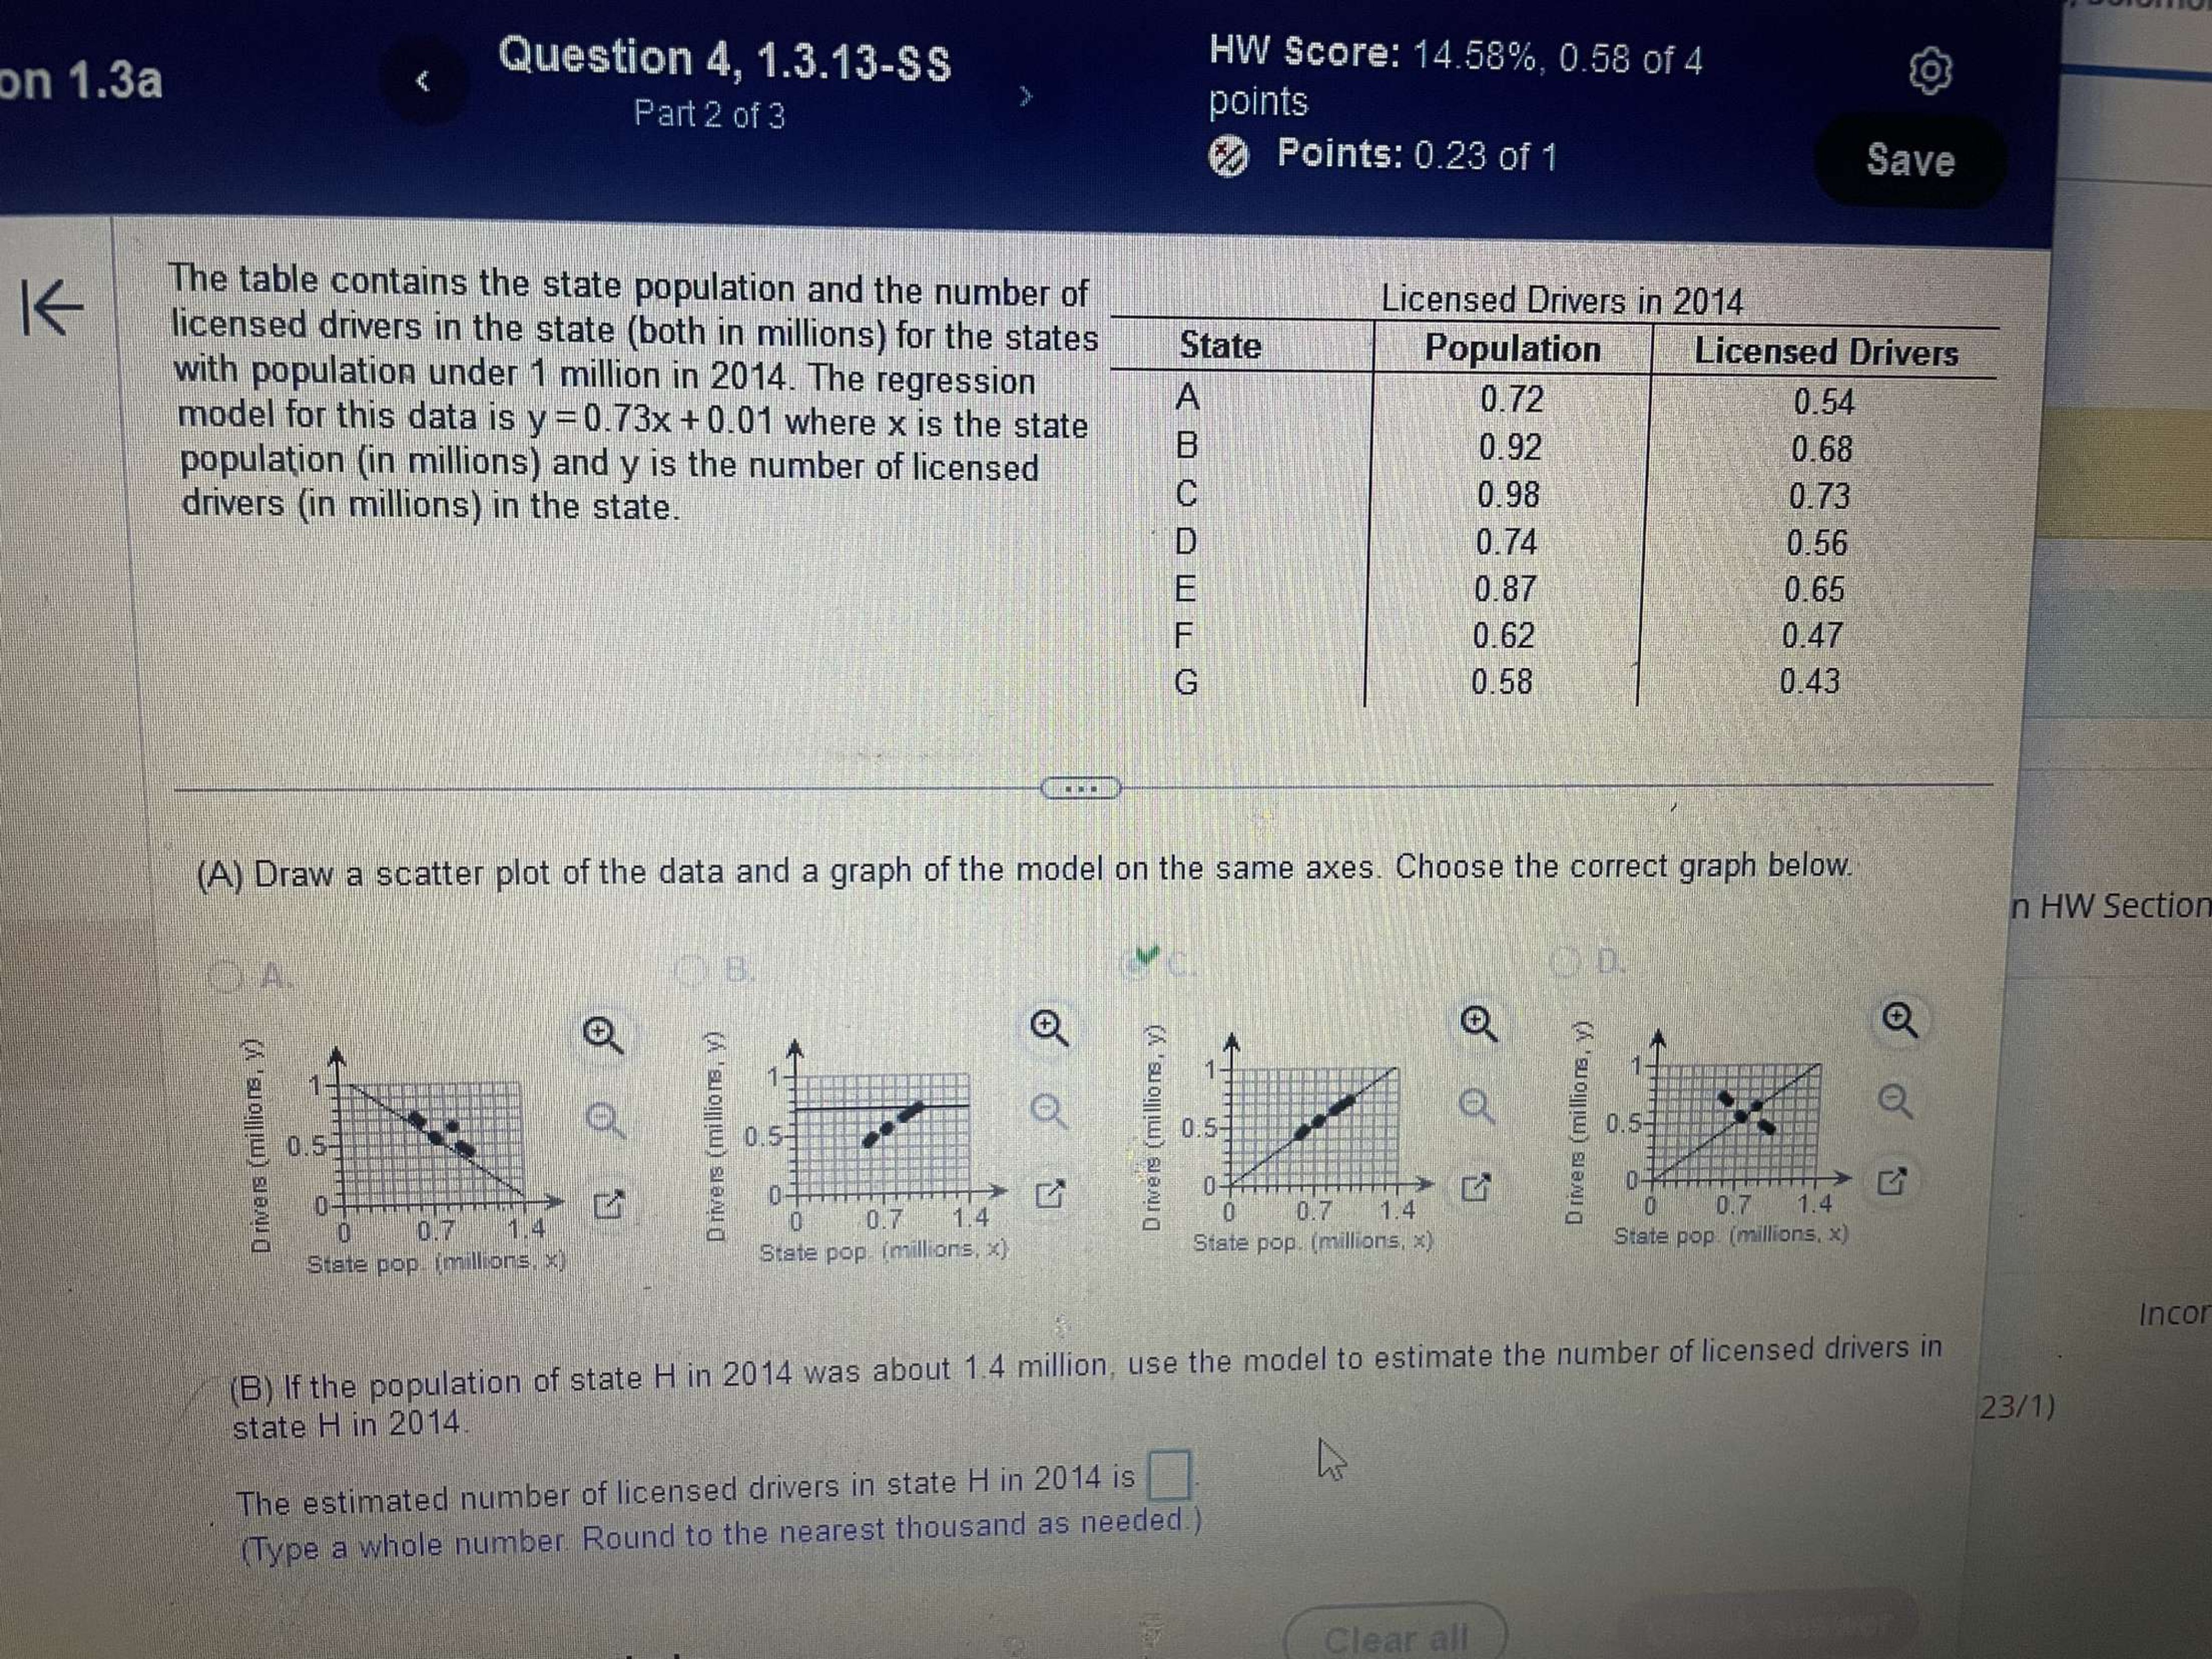
Work.aspx:homeworkId=6428357 7 68 questionld = 1&flushed =false& cld = 7 2746058( * E d Economics MWF 1:00-1:50 Solomon Starks Jr. 02/20/23 8:49 PM Solomon ion 1.3a Question 1, 1.3.1-LS HW Score: 14.58%, 0.58 of 4 Part 1 of 4 points O Points: 0 of 1 Save K One estimate for the ideal body weight of a woman is shown below. Use this information to answer parts (A) through (D). 55 kg + 1.3 kg for each inch over 5 feet (A) Find a linear model for an estimate of the ideal weight of a woman using w for ideal body weight (in kilograms) and h for height over 5 feet (in inches) w = (Type an equation using h as the variable.) n HW Sectio Inction 1.3a Question 3, 1.3.11-SS HW Score: 14.58%, 0.58 of 4 Part 2 of 2 points Points: 0.35 of 1 Save K The data shows that the percentage of female cigarette smokers in a Percentage of Smoking Prevalence among U.S. certain country declined from 21.9% in 1997 to 14.8% in 2015. Adults Answer parts (A) through (B). Year Males (%) Females (%) 1997 27.5 21.9 2000 25.7 20.8 2003 24.3 19.5 2006 23.6 17.9 2010 21.6 16.9 2015 16.9 14.8 graph of the regression model on the same axes. Choose the correct answer below. n HW Section 1.3 30 30 30- 30 "% female smokers (f) % female smokers (f) % female smokers (f) 15- 15 "% female smokers (f) 15 20 10 120 10 20 0 10 20 Years since 1897 (1) Years since 1097 {t) Years since 1897 Years since 1897 {t) Incorrect (B) Estimate the first year in which the percentage of female smokers is less than 5% 23/1) The first year in which the percentage of female smokers is less than 5% is Round up to the nearest year ) Clear all View an example Get more help -on 1.3a Question 4, 1.3.13-SS HW Score: 14.58%, 0.58 of 4 fo Part 2 of 3 points Points: 0.23 of 1 Save K The table contains the state population and the number of licensed drivers in the state (both in millions) for the states Licensed Drivers in 2014 with population under 1 million in 2014. The regression State Population Licensed Drivers model for this data is y = 0.73x + 0.01 where x is the state 0.72 0.54 population (in millions) and y is the number of licensed 0.92 0.68 drivers (in millions) in the state. 0.98 0.73 0.74 0.56 0.87 0.65 0.62 0.47 0.58 0.43 (A) Draw a scatter plot of the data and a graph of the model on the same axes. Choose the correct graph below. n HW Section Drivers (millions, y) Drivers (millions, y) 0. 0.5- Drivers (millions, y) Drivers (millions, y) 0.5 0.5- O.7 O 0.7 0.7 1.4 O 0.7 1.4 State pop (millions. State pop (millions, x) State pop. (millions, x) State pop. (millions, x) Incor (B) If the population of state H in 2014 was about 1.4 million, use the model to estimate the number of licensed drivers in state H in 2014. 23/1) The estimated number of licensed drivers in state H in 2014 is (Type a whole number Round to the nearest thousand as needed.) Clear all
Step by Step Solution
There are 3 Steps involved in it

Get step-by-step solutions from verified subject matter experts