

Workforce Ignorance of the company's objectives - Lack of awareness of the importance of their work...
Fantastic news! We've Found the answer you've been seeking!
Question:
Transcribed Image Text:
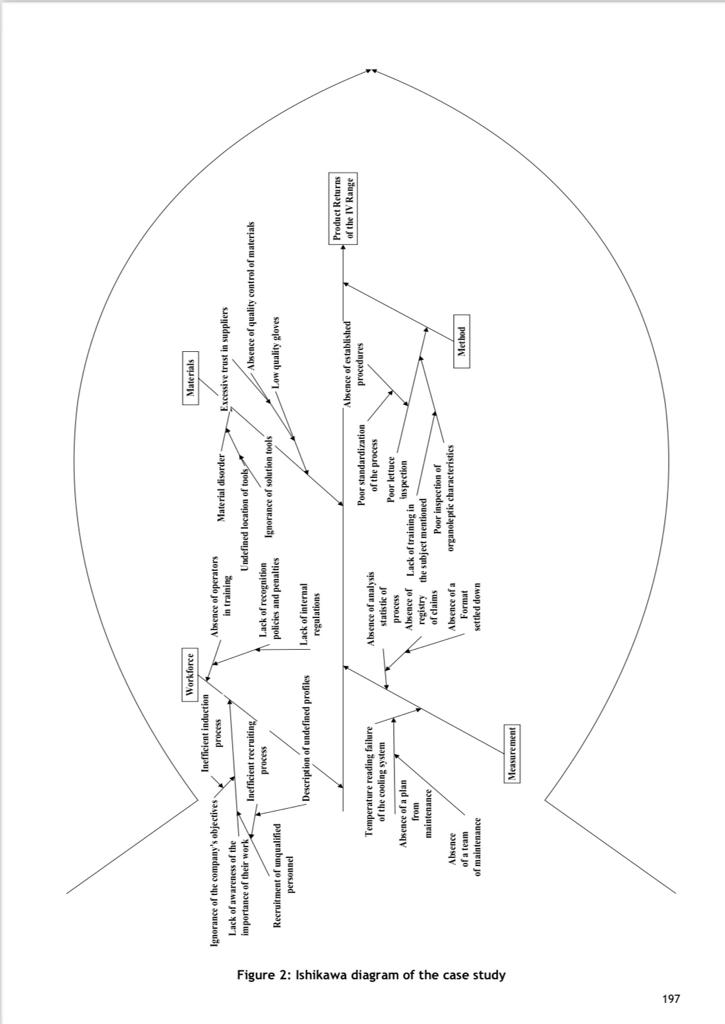
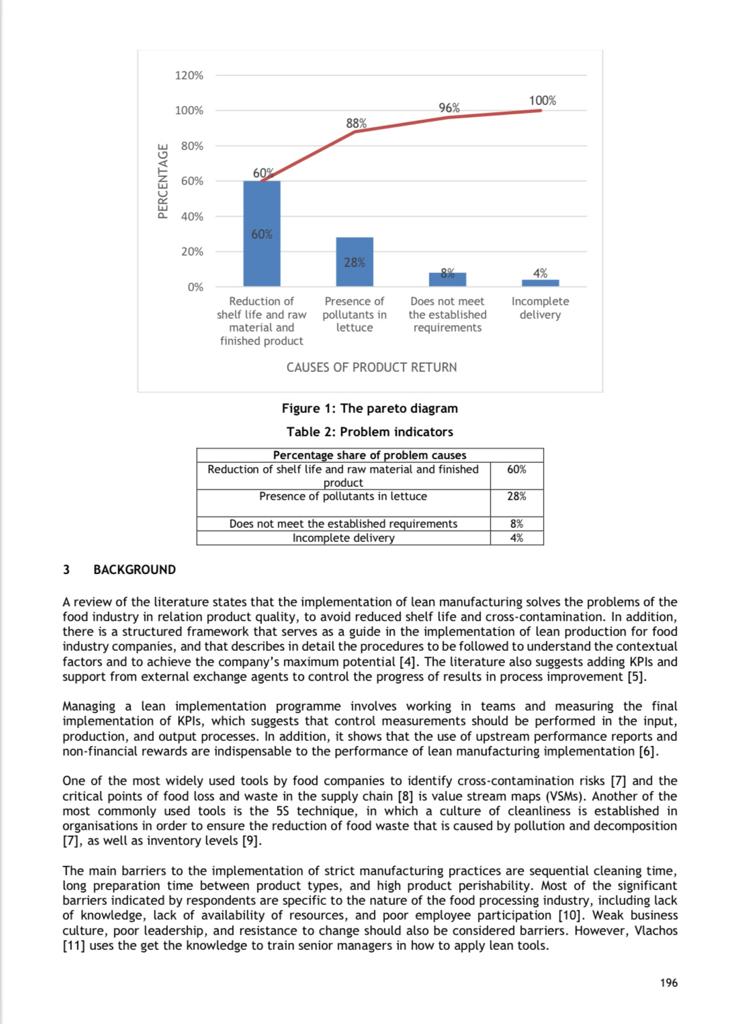
Workforce Ignorance of the company's objectives - Lack of awareness of the importance of their work Recruitment of unqualified personnel Inefficient induction process Inefficient recruiting/ process Description of undefined profiles Figure 2: Ishikawa diagram of the case study 197 in training Absence of operators Material disorder- Undefined location of tools Lack of recognition Ignorance of solution tools policies and penalties Lack of internal regulations Materials Excessive trust in suppliers Absence of quality control of materials Low quality gloves Temperature reading failure of the cooling system Absence of analysis statistic of Poor standardization of the process Absence of a plan Poor lettuce inspection from maintenance Absence of a team of maintenance Measurement process Absence of Lack of training in registry the subject mentioned of claims Absence of a Format settled down Poor inspection of organoleptic characteristics Absence of established procedures Method Product Returns of the IV Range 1 INTRODUCTION In the first half of 2018, the Peruvian food sector, exports in the fruit and vegetable sub-sector grew according to the Association of Agricultural Producers Guilds of Peru (AGAP), reaching US$ 1,389 million, which represented 26 per cent of all exports. Fresh fruit grew by 29 per cent or $1,236 million in the first half of this year, compared with the previous year. In addition, the fresh vegetable sub-sector grew by seven per cent in the first six months of the year 2018. The most important ones were fresh asparagus, at US$ 127 million, an increase of six per cent; fresh onion, at US$ 17 million, and increase of 62 per cent; and fresh peas, at US$ 3 million, equivalent to a 109 per cent increase over the previous period [1]. 194 The quality of processed and ready-to-eat plant products is often the result of a combination of attributes. The relevant attributes of organoleptic quality include appearance, texture, smell, and taste, along with others relating to nutritional quality and food safety. Symptoms of deterioration of these products include changes in colour, and the appearance of oxidative browning on cut surfaces [2]. These factors influence the quality compliance and quality assurance of finished food products that are perishable and need to be consumed without delay. 2 PROBLEM The case study was carried out in a food SME of the 'fourth range' located in Lima. The products in the fourth range are those that are processed as fresh, clean, chopped, and packaged vegetables and fruits for consumption. Their largest commercial market is through the HORECA (hotels, restaurants, and casinos) channel. The importance of this sub-sector lies in ensuring and providing quality products to the consumer. That is why the information obtained from the historical data of claims and/or returns of products by customers during 2018 was analysed. As a result of the analysis, it was concluded that the return rate of products completed in 2018 was 2.1 per cent of total production, representing a total amount of 4,352 defective bags per year. In addition, the main economic causes and consequences were identified, representing nine per cent of the total turnover in economic losses. The Ishikawa diagram of this case study is shown in Figure 1. Table 1 indicates the percentage of products returned, based on the type of problem presented for each month in 2018. It can be seen that 4,352 bags of products were returned, representing 2.10 per cent of the production in that year. Table 1: Historical record of percentage of product returns in 2018 MONTH JANUARY FEBRUARY % CONTAMINANT AGENT % USEFUL LIFE 44% 38% 33% 50% MARCH 19% 81% APRIL 10% 70% MAY 40% 20% JUNE 25% 75% JULY 11% 67% AUGUST 33% 67% SEPTEMBER 25% 75% OCTOBER 33% 67% NOVEMBER 33% 67% DECEMBER 33% 44% TOTAL 4352 bags 2,10% An analysis of the Pareto diagram was carried out to identify the main causes of product returns, and it was found that more than 80 per cent of the cause were the reduction in shelf life and the presence of contaminants in lettuce, as shown in Table 2. Once the main causes of the problem has been identified, the tools and/or methods that could address the causes of the identified problem were identified. 195 PERCENTAGE 120% 100% 80% 60% 60% 40% 20% 160% 100% 96% 88% 28% 4% 0% Reduction of Presence of shelf life and raw pollutants in Does not meet the established Incomplete delivery material and lettuce requirements finished product CAUSES OF PRODUCT RETURN Figure 1: The pareto diagram Table 2: Problem indicators Percentage share of problem causes Reduction of shelf life and raw material and finished product Presence of pollutants in lettuce Does not meet the established requirements Incomplete delivery 60% 28% 8% 4% 3 BACKGROUND A review of the literature states that the implementation of lean manufacturing solves the problems of the food industry in relation product quality, to avoid reduced shelf life and cross-contamination. In addition, there is a structured framework that serves as a guide in the implementation of lean production for food industry companies, and that describes in detail the procedures to be followed to understand the contextual factors and to achieve the company's maximum potential [4]. The literature also suggests adding KPIs and support from external exchange agents to control the progress of results in process improvement [5]. Managing a lean implementation programme involves working in teams and measuring the final implementation of KPIs, which suggests that control measurements should be performed in the input, production, and output processes. In addition, it shows that the use of upstream performance reports and non-financial rewards are indispensable to the performance of lean manufacturing implementation [6]. One of the most widely used tools by food companies to identify cross-contamination risks [7] and the critical points of food loss and waste in the supply chain [8] is value stream maps (VSMS). Another of the most commonly used tools is the 5S technique, in which a culture of cleanliness is established in organisations in order to ensure the reduction of food waste that is caused by pollution and decomposition [7], as well as inventory levels [9]. The main barriers to the implementation of strict manufacturing practices are sequential cleaning time, long preparation time between product types, and high product perishability. Most of the significant barriers indicated by respondents are specific to the nature of the food processing industry, including lack of knowledge, lack of availability of resources, and poor employee participation [10]. Weak business culture, poor leadership, and resistance to change should also be considered barriers. However, Vlachos [11] uses the get the knowledge to train senior managers in how to apply lean tools. 196 Workforce Ignorance of the company's objectives - Lack of awareness of the importance of their work Recruitment of unqualified personnel Inefficient induction process Inefficient recruiting/ process Description of undefined profiles Figure 2: Ishikawa diagram of the case study 197 in training Absence of operators Material disorder- Undefined location of tools Lack of recognition Ignorance of solution tools policies and penalties Lack of internal regulations Materials Excessive trust in suppliers Absence of quality control of materials Low quality gloves Temperature reading failure of the cooling system Absence of analysis statistic of Poor standardization of the process Absence of a plan Poor lettuce inspection from maintenance Absence of a team of maintenance Measurement process Absence of Lack of training in registry the subject mentioned of claims Absence of a Format settled down Poor inspection of organoleptic characteristics Absence of established procedures Method Product Returns of the IV Range 1 INTRODUCTION In the first half of 2018, the Peruvian food sector, exports in the fruit and vegetable sub-sector grew according to the Association of Agricultural Producers Guilds of Peru (AGAP), reaching US$ 1,389 million, which represented 26 per cent of all exports. Fresh fruit grew by 29 per cent or $1,236 million in the first half of this year, compared with the previous year. In addition, the fresh vegetable sub-sector grew by seven per cent in the first six months of the year 2018. The most important ones were fresh asparagus, at US$ 127 million, an increase of six per cent; fresh onion, at US$ 17 million, and increase of 62 per cent; and fresh peas, at US$ 3 million, equivalent to a 109 per cent increase over the previous period [1]. 194 The quality of processed and ready-to-eat plant products is often the result of a combination of attributes. The relevant attributes of organoleptic quality include appearance, texture, smell, and taste, along with others relating to nutritional quality and food safety. Symptoms of deterioration of these products include changes in colour, and the appearance of oxidative browning on cut surfaces [2]. These factors influence the quality compliance and quality assurance of finished food products that are perishable and need to be consumed without delay. 2 PROBLEM The case study was carried out in a food SME of the 'fourth range' located in Lima. The products in the fourth range are those that are processed as fresh, clean, chopped, and packaged vegetables and fruits for consumption. Their largest commercial market is through the HORECA (hotels, restaurants, and casinos) channel. The importance of this sub-sector lies in ensuring and providing quality products to the consumer. That is why the information obtained from the historical data of claims and/or returns of products by customers during 2018 was analysed. As a result of the analysis, it was concluded that the return rate of products completed in 2018 was 2.1 per cent of total production, representing a total amount of 4,352 defective bags per year. In addition, the main economic causes and consequences were identified, representing nine per cent of the total turnover in economic losses. The Ishikawa diagram of this case study is shown in Figure 1. Table 1 indicates the percentage of products returned, based on the type of problem presented for each month in 2018. It can be seen that 4,352 bags of products were returned, representing 2.10 per cent of the production in that year. Table 1: Historical record of percentage of product returns in 2018 MONTH JANUARY FEBRUARY % CONTAMINANT AGENT % USEFUL LIFE 44% 38% 33% 50% MARCH 19% 81% APRIL 10% 70% MAY 40% 20% JUNE 25% 75% JULY 11% 67% AUGUST 33% 67% SEPTEMBER 25% 75% OCTOBER 33% 67% NOVEMBER 33% 67% DECEMBER 33% 44% TOTAL 4352 bags 2,10% An analysis of the Pareto diagram was carried out to identify the main causes of product returns, and it was found that more than 80 per cent of the cause were the reduction in shelf life and the presence of contaminants in lettuce, as shown in Table 2. Once the main causes of the problem has been identified, the tools and/or methods that could address the causes of the identified problem were identified. 195 PERCENTAGE 120% 100% 80% 60% 60% 40% 20% 160% 100% 96% 88% 28% 4% 0% Reduction of Presence of shelf life and raw pollutants in Does not meet the established Incomplete delivery material and lettuce requirements finished product CAUSES OF PRODUCT RETURN Figure 1: The pareto diagram Table 2: Problem indicators Percentage share of problem causes Reduction of shelf life and raw material and finished product Presence of pollutants in lettuce Does not meet the established requirements Incomplete delivery 60% 28% 8% 4% 3 BACKGROUND A review of the literature states that the implementation of lean manufacturing solves the problems of the food industry in relation product quality, to avoid reduced shelf life and cross-contamination. In addition, there is a structured framework that serves as a guide in the implementation of lean production for food industry companies, and that describes in detail the procedures to be followed to understand the contextual factors and to achieve the company's maximum potential [4]. The literature also suggests adding KPIs and support from external exchange agents to control the progress of results in process improvement [5]. Managing a lean implementation programme involves working in teams and measuring the final implementation of KPIs, which suggests that control measurements should be performed in the input, production, and output processes. In addition, it shows that the use of upstream performance reports and non-financial rewards are indispensable to the performance of lean manufacturing implementation [6]. One of the most widely used tools by food companies to identify cross-contamination risks [7] and the critical points of food loss and waste in the supply chain [8] is value stream maps (VSMS). Another of the most commonly used tools is the 5S technique, in which a culture of cleanliness is established in organisations in order to ensure the reduction of food waste that is caused by pollution and decomposition [7], as well as inventory levels [9]. The main barriers to the implementation of strict manufacturing practices are sequential cleaning time, long preparation time between product types, and high product perishability. Most of the significant barriers indicated by respondents are specific to the nature of the food processing industry, including lack of knowledge, lack of availability of resources, and poor employee participation [10]. Weak business culture, poor leadership, and resistance to change should also be considered barriers. However, Vlachos [11] uses the get the knowledge to train senior managers in how to apply lean tools. 196
Expert Answer:

Posted Date:
Students also viewed these general management questions
-
What is the term for an instance when the audience expects one outcome and receives the opposite
-
Question: What as the average weekly safety inventory level of refined sugar from the beginning January 2022 to the end of July 2022? A. 512,465.9691 metric tons per week B. 316,002.1474 metric tons...
-
Risk Analysis and Management of Construction and Operations in Offshore Wind Power Project Abstract: Many countries have increased the use of renewable energy and strongly promoted offshore wind...
-
A 200 g mass attached to a horizontal spring oscillates at a frequency of 1.5 Hz. At one instant, the mass is at x = 70 mm and has vx = -0.2 m/s. Determine (a) The period (b) The amplitude (c) The...
-
What does it mean when two events are complements?
-
A simple ideal Rankine cycle with water as the working fluid operates between the pressure limits of 4 MPa in the boiler and 20 kPa in the condenser and a turbine inlet temperature of 700C. Calculate...
-
Which of the following statements is false? a. A flowchart is an analytical technique used to describe some aspect of an information system in a clear, concise, and logical manner. b. Flowcharts use...
-
The following diagram shows a four- step process that begins with Operation 1 and ends with Operation 4. The rates shown in each box represent the effective capacity of that operation. a. Determine...
-
Estimate the value per share, using dividend discount model (6marks) Estimate the value per share using the free cash flow to equity (FCFE) model (6 marks) How would you explain the different between...
-
Allegations were made against the CEO (Chanda Kochhar) of a bank in India. She was accused of nepotism and conflict of interest because she sanctioned a high-value loan to a company called Videocon....
-
BANK OF CENTENNIAL Credit Card Statement of Account Credit Limit Account Number Interest Rates Annual Daily Limit: Available: $5,000.00 497 332 8751889 Purchases 17.999 0.04929 $3,344.69 Cash Advance...
-
Find the GCF. -2z3 + 6z + 4z
-
Please refer to a partial footnote from 1999 Callaway Golf Co. After long economic boom US firms were facing a major economic slowdown from 1999 and on. Some of the investors questioned Callaway's...
-
Tyler Company has the following information related to purchases and sales of one of its inventory items. Date Description Units Purchased at Cost Units Sold at Retail Sept. 1 Sept. 10 Beginning...
-
With regards to the AstraZeneca Canada Inc. v. Apotex Inc. case of 2017 details of which are given in the article attached with this folder to report (Introduction, Main Body, Conclusion, and APA...
-
Replace the distributed loading shown with an equivalent Single force and state where the force acts on the beam measured from the left end. 16 kN/m 4 kN/m B A 2m * 2m - 2m 2m. 2m 1 kr/m
-
Evenflow Power Co. is considering a new project that is a little riskier than the current operations of the company. Thus, management has decided to add an additional 1.5% to the company's overall...
-
The Manhattan Company has \($265\) million in assets, \($90\) million in current liabilities, \($135\) million in noncurrent liabilities, and \($40\) million in shareholders equity. Of the companys...
-
Presented below are common-sized income statement data for three well-known companies representing three different industries (pharmaceutical, beverage, and diversified): 1. Bristol-Myers Squibb 2....
-
Presented below are selected financial data for two competitors. Discuss why the return on assets increased for Company A but decreased for Company B. Company A. Company B Return on Assets Return on...

Study smarter with the SolutionInn App