

Question: WORKSHEET 12a STAT WORKSHEET 12a Name: Teacher: Date: 1. The table below shows the leadership evaluation ratings of the 12 production heads rate independently
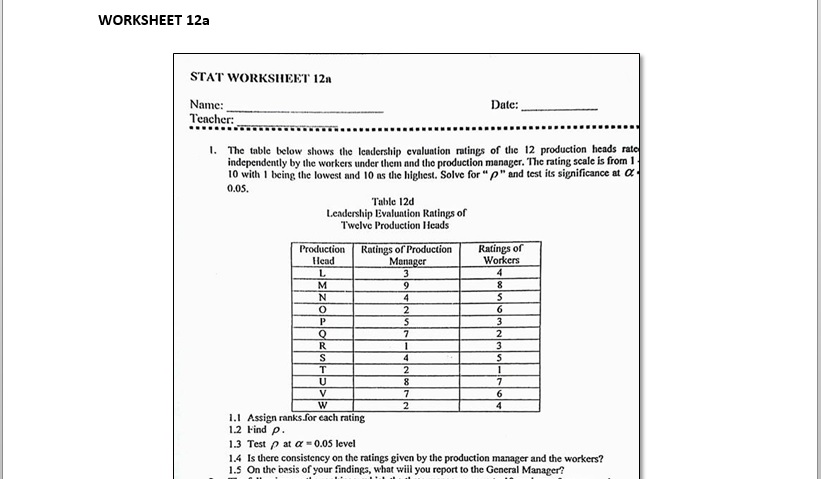
WORKSHEET 12a STAT WORKSHEET 12a Name: Teacher: Date: 1. The table below shows the leadership evaluation ratings of the 12 production heads rate independently by the workers under them and the production manager. The rating scale is from 1 10 with 1 being the lowest and 10 as the highest. Solve for "p" and test its significance at 0.05. Table 12d Leadership Evaluation Ratings of Twelve Production Heads Production Ratings of Production Ratings of Head Manager Workers L 3 4 M 9 8 N 4 2 6 P S 3 Q 7 2 R 1 3 S 4 5 T 2 U 8 7 V 7 6 W 2 4 1.1 Assign ranks.for each rating 1.2 Find p. 1.3 Test at a 0.05 level 1.4 Is there consistency on the ratings given by the production manager and the workers? 1.5 On the basis of your findings, what will you report to the General Manager?
Step by Step Solution
There are 3 Steps involved in it

Get step-by-step solutions from verified subject matter experts