

Question: Would age-adjusted rates be more appropriate for comparing the risk of female breast cancer among geographic areas and racial groups? Explain. TABLE 4-12 Female Crude
Would age-adjusted rates be more appropriate for comparing the risk of female breast cancer among geographic areas and racial groups? Explain.
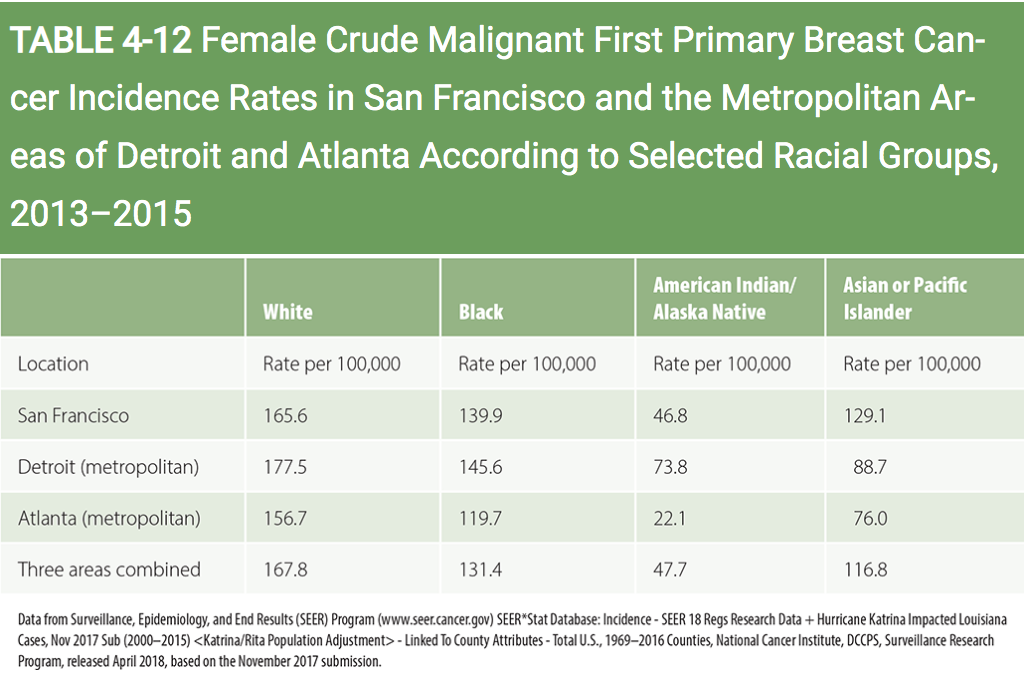
TABLE 4-12 Female Crude Malignant First Primary Breast Can- cer Incidence Rates in San Francisco and the Metropolitan Ar- eas of Detroit and Atlanta According to Selected Racial Groups, 2013-2015 American Indian/ Asian or Pacific White Black Alaska Native Islander Location Rate per 100,000 Rate per 100,000 Rate per 100,000 Rate per 100,000 San Francisco 165.6 139.9 46.8 129.1 Detroit (metropolitan) 177.5 145.6 73.8 88.7 Atlanta (metropolitan) 156.7 119.7 22.1 76.0 Three areas combined 167.8 131.4 47.7 116.8 Data from Surveillance, Epidemiology, and End Results (SEER) Program (www.seer.cancer.gov) SEER*Stat Database: Incidence - SEER 18 Regs Research Data + Hurricane Katrina Impacted Louisiana Cases, Nov 2017 Sub (2000-2015)
Step by Step Solution
There are 3 Steps involved in it

Get step-by-step solutions from verified subject matter experts