

Question: Would like some guidance in solving this problem. 1. Let x represent the age of eight randomly selected students and y represent the number of
Would like some guidance in solving this problem.
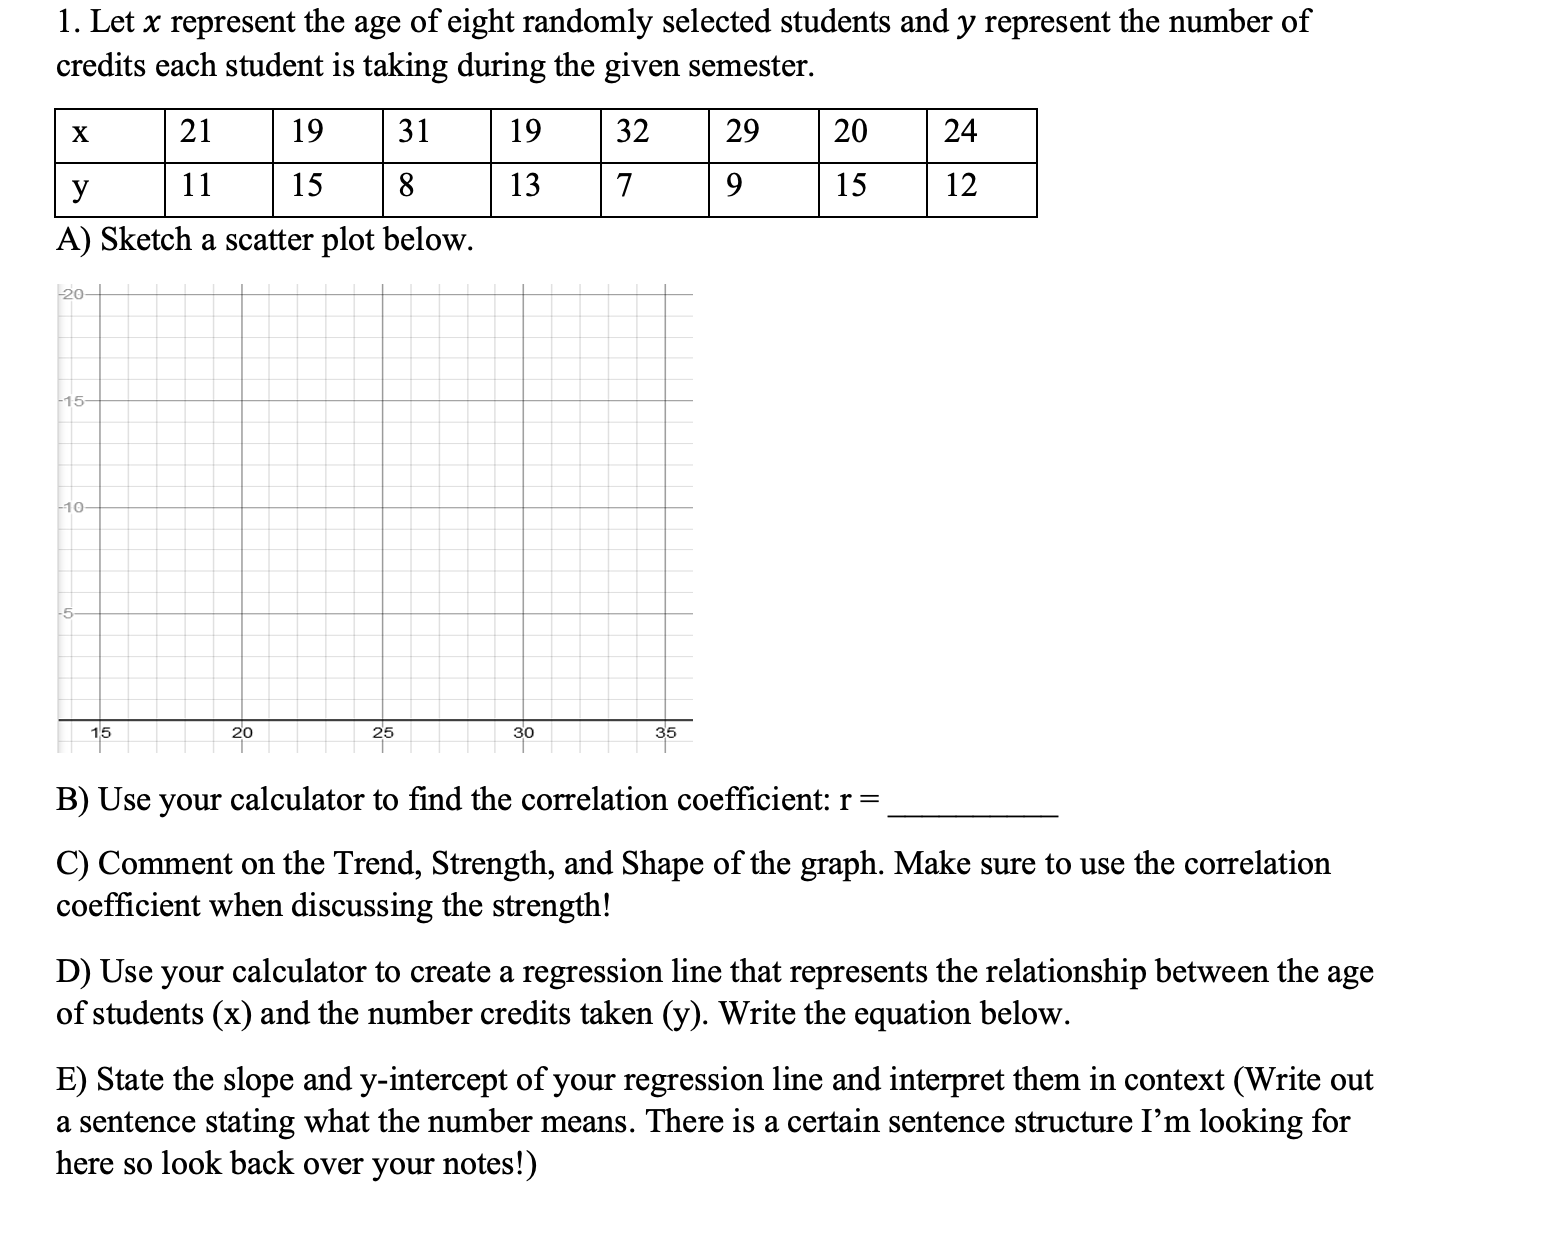
1. Let x represent the age of eight randomly selected students and y represent the number of credits each student is taking during the given semester. X 21 19 31 19 32 29 20 24 y 11 15 8 13 7 9 15 12 A) Sketch a scatter plot below. 20- -15- -10- 15 20 25 30 35 B) Use your calculator to find the correlation coefficient: r = C) Comment on the Trend, Strength, and Shape of the graph. Make sure to use the correlation coefficient when discussing the strength! D) Use your calculator to create a regression line that represents the relationship between the age of students (x) and the number credits taken (y). Write the equation below. E) State the slope and y-intercept of your regression line and interpret them in context (Write out a sentence stating what the number means. There is a certain sentence structure I'm looking for here so look back over your notes!)
Step by Step Solution
There are 3 Steps involved in it

Get step-by-step solutions from verified subject matter experts