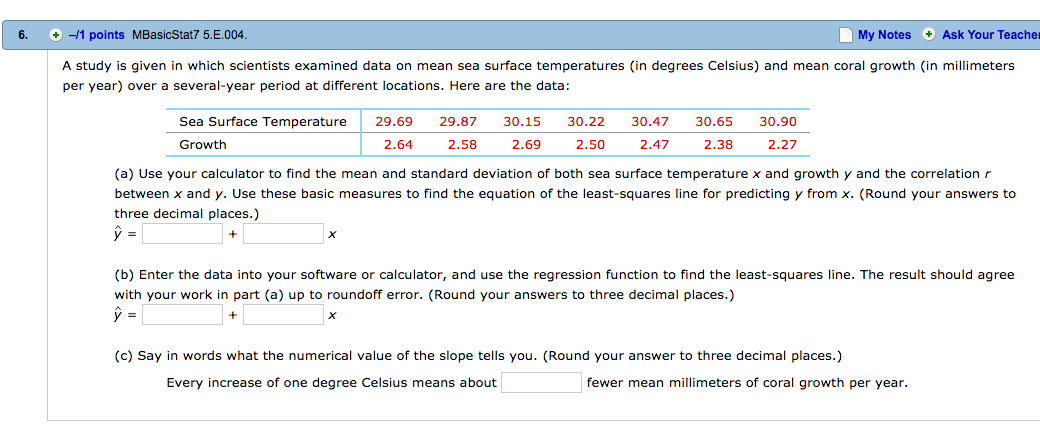
Question: Would someone please walk me through how to work through please? A study ls given in which scientists examined data on mean sea surface temperatures

Would someone please walk me through how to work through please?

Would someone please walk me through how to workWould someone please walk me through how to work
A study ls given in which scientists examined data on mean sea surface temperatures (in degrees Celsius) and mean coral growth (in millimeters per year) over a several-year period at different locations. Here are the data: 29.69 29.87 30.15 30.22 30.47 30.65 30.90 2.54 2.58 2.69 2.50 2.47 2.38 2.2? Sea Surface Temperature Growth (a) Use your calculatorto find the mean and standard deviation of both sea surface temperature x and growth y and the correlation :- between x and y. Use these basic measures to nd the equation of the least-squares line for predicting y from x. (Round your answers to three decimal places.) i); ' + x (In) Enter the data Into your software or calculator, and use the regrewion function to find the least-squares line. The result should agree with your work in part (a) up to roundoff error. (Round your answers to three decimal places.) i?" + x (c) Say in words what the numerical value of the slope tells you. {Round your answer to three decimal places.) Every increase of one degree Celsius means about fewer mean millimeters of coral growth per year. The patient recoveryr tlme from a particular surgical procedure l5 normally distributed with a mean of 5.9 days and a standard deviation of 2.1 days. What is the 80th percentile For recomlnerylr tlmes? (Round your answer to two decimal places.) days

Step by Step Solution

There are 3 Steps involved in it

1 Expert Approved Answer
Step: 1 Unlock blur-text-image
Question Has Been Solved by an Expert!

Get step-by-step solutions from verified subject matter experts

Step: 2 Unlock
Step: 3 Unlock

Students Have Also Explored These Related Mathematics Questions!