

Question: Would you expect the correlation coefficient between the following pairs of variables to be positive, approximately zero or negative? (a) Marital status and happiness (assume


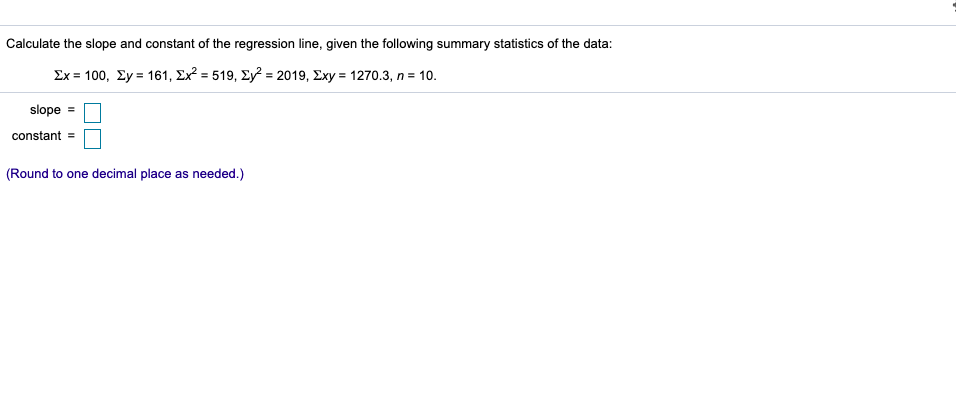
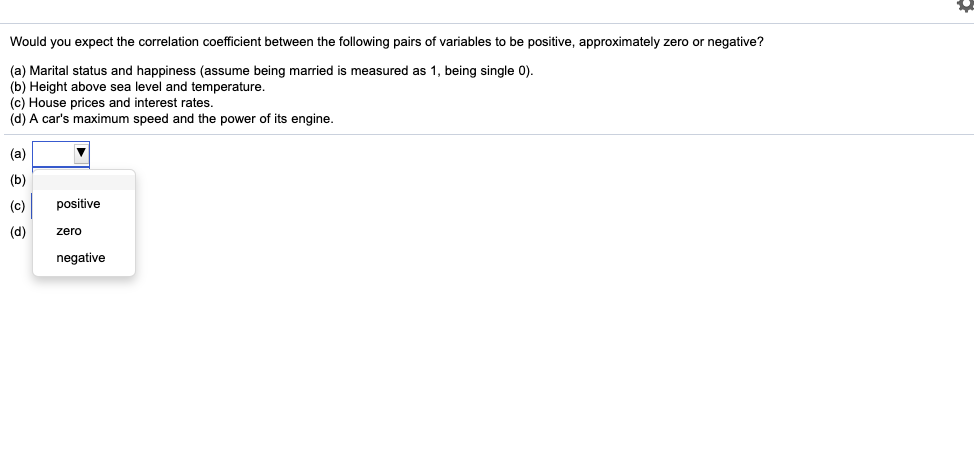
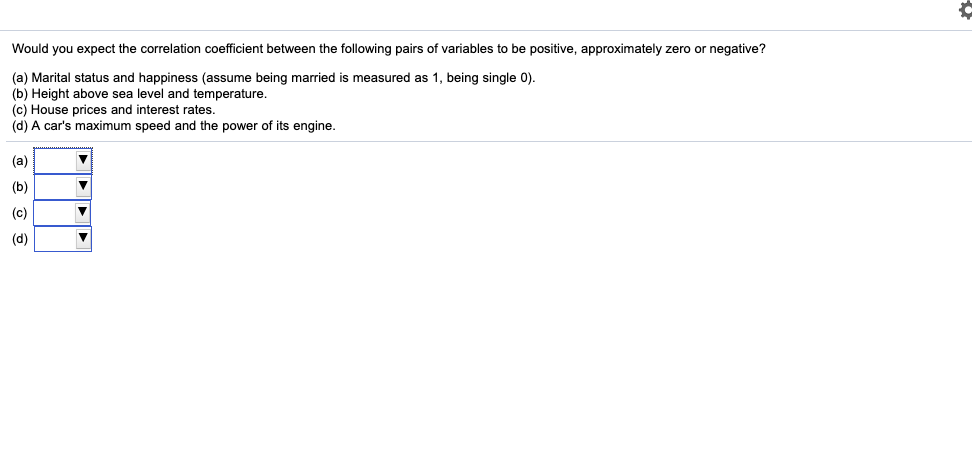
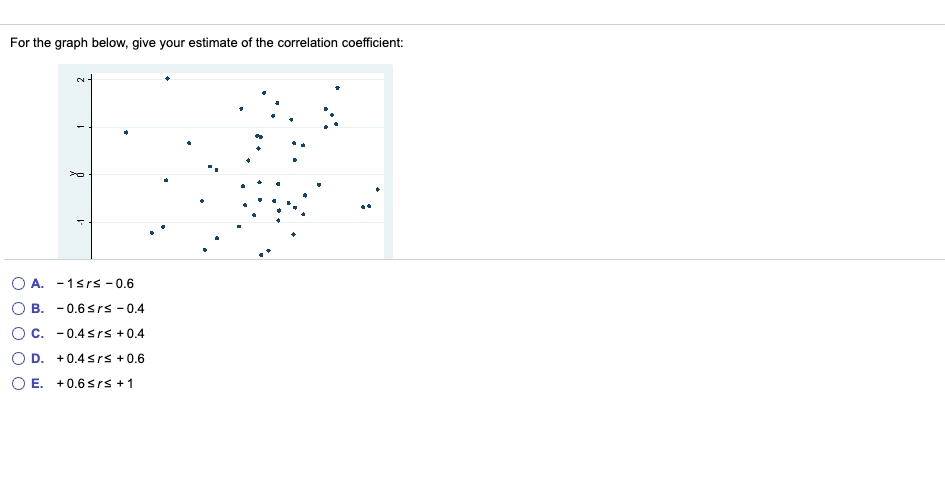


Would you expect the correlation coefficient between the following pairs of variables to be positive, approximately zero or negative? (a) Marital status and happiness (assume being married is measured as 1, being single 0). (b) Height above sea level and temperature. (c) House prices and interest rates. (d) A car's maximum speed and the power of its engine. (a) (b) (c) positive (d) zero negativeWould you expect the correlation coefficient between the following pairs of variables to be positive, approximately zero or negative? (a) Marital status and happiness (assume being married is measured as 1, being single 0). (b) Height above sea level and temperature. (c) House prices and interest rates. (d) A car's maximum speed and the power of its engine. (a)For the graph below, give your estimate of the correlation coefficient: ry - O A. - 1srs - 0.6 OB. -0.6srs - 0.4 O C. -0.4srs +0.4 OD. +0.4srs +0.6 OE. +0.6srs +1The following are the data on birth rate and income ratio for a sample of 12 (a) Perform the required calculations to find the correlation between the birth rate developing countries. and the income ratio. Birth rate Income (b) Calculate the correlation coefficient between the birth rate and the growth rate Y ratio X again, but expressing the birth rate per 100 population and the growth rate as a Brazil 30 7.6 decimal. (In other words, divide Y by 10 and X by 100.) Colombia 25 9.3 Costa Rica 24 6.4 India 33 4.9 Mexico 38 8.4 Peru 28 3.7 Philippines 28 5.8 Senegal 30 3.8 a... an (a) The correlation coefficient r is. (Round to three decimal places as needed.) (b) The correlation coefficient ris (Round to three decimal places as needed.)Calculate the slope and constant of the regression line, given the following summary statistics of the data: Ex = 100, Ey = 161, Ex2 = 519, Ey2 = 2019, Exy = 1270.3, n = 10. slope = constant = (Round to one decimal place as needed.)
Step by Step Solution
There are 3 Steps involved in it

Get step-by-step solutions from verified subject matter experts