

Question: write a break-even analysis based on the following data 1 BREAK-EVEN ANALYSIS DR01-05 DR01-08 DRO1-07 Revenue Expenses Total Fixed Costs 131 151 $1 FY1 TOTAL
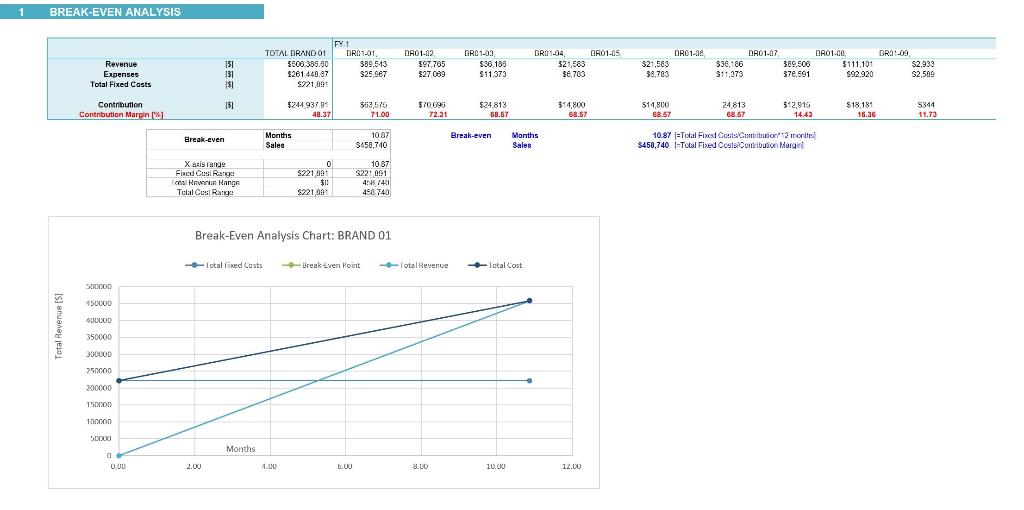
write a break-even analysis based on the following data
Step by Step Solution
There are 3 Steps involved in it
1 Expert Approved Answer
Step: 1 Unlock

Question Has Been Solved by an Expert!
Get step-by-step solutions from verified subject matter experts
Step: 2 Unlock
Step: 3 Unlock