

Question: write a code in matlab or python to plot the graphs assume any value ck2=(TpA)2,(TpA)2(kF0sinkF0)2,k=0k=1,2, Figure 4.1.5 Fourier coefficients of the rectangular pulse train when
write a code in matlab or python to plot the graphs assume any value
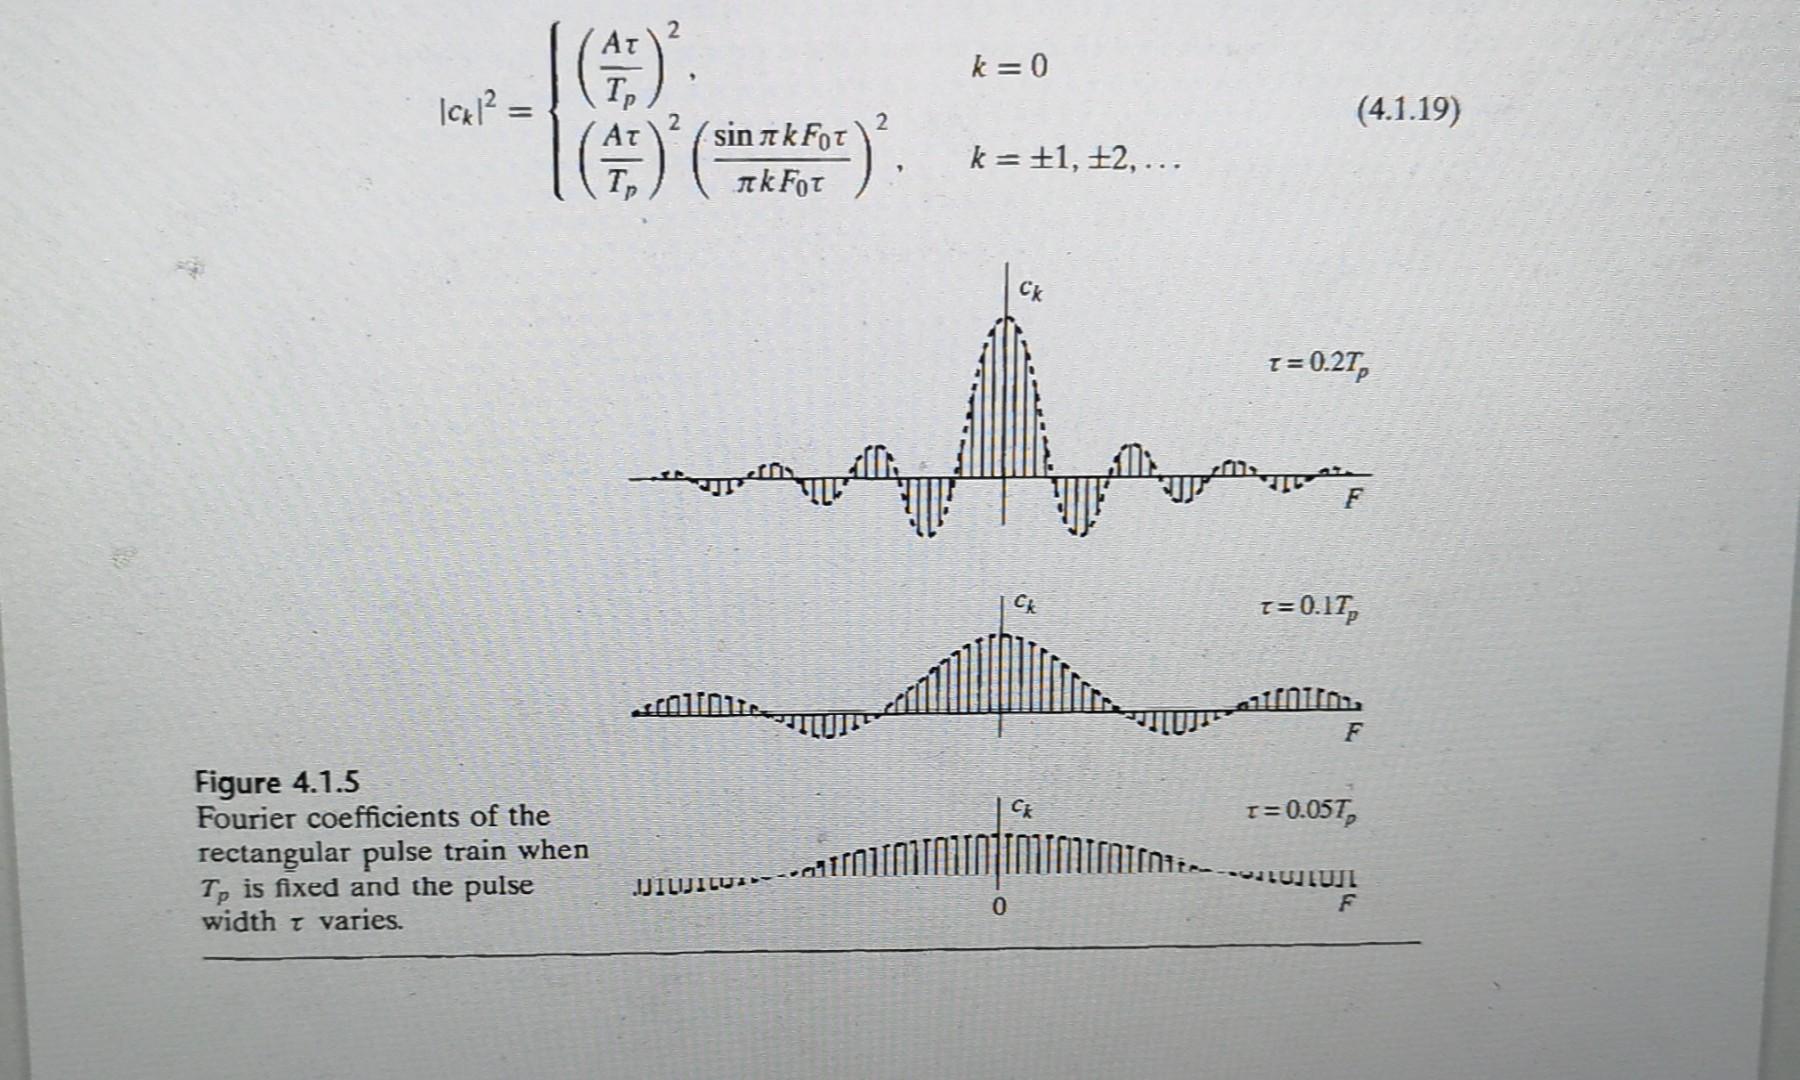
ck2=(TpA)2,(TpA)2(kF0sinkF0)2,k=0k=1,2, Figure 4.1.5 Fourier coefficients of the rectangular pulse train when Tp is fixed and the pulse width varies
Step by Step Solution
There are 3 Steps involved in it
1 Expert Approved Answer
Step: 1 Unlock

Question Has Been Solved by an Expert!
Get step-by-step solutions from verified subject matter experts
Step: 2 Unlock
Step: 3 Unlock