

Question: Write a function M - file that implements ( 8 ) in the interval 0 t 5 5 . Note that the initial condition must
Write a function Mfile that implements in the interval Note that the initial
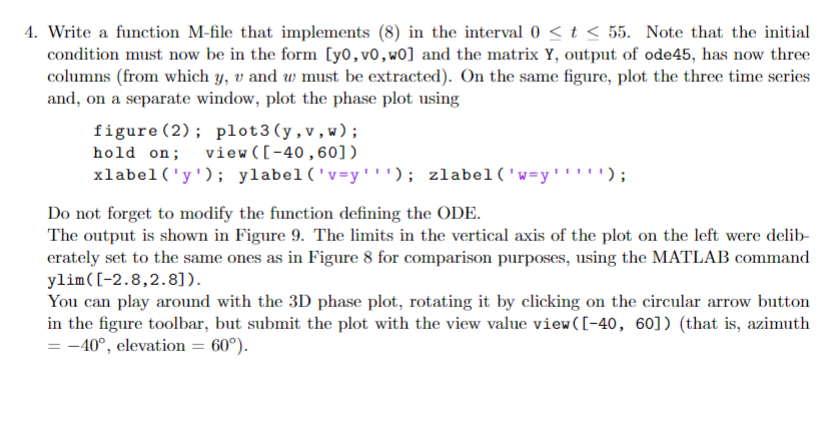
condition must now be in the form and the matrix output of ode has now three
columns from which and must be extracted On the same figure, plot the three time series
and, on a separate window, plot the phase plot using
figure; plot;
hold on; view
xlabely; ylabelvy; zlabelwy;
Do not forget to modify the function defining the ODE.
The output is shown in Figure The limits in the vertical axis of the plot on the left were delib
erately set to the same ones as in Figure for comparison purposes, using the MATLAB command
You can play around with the D phase plot, rotating it by clicking on the circular arrow button
in the figure toolbar, but submit the plot with the view value view that is azimuth
elevation
Step by Step Solution
There are 3 Steps involved in it
1 Expert Approved Answer
Step: 1 Unlock

Question Has Been Solved by an Expert!
Get step-by-step solutions from verified subject matter experts
Step: 2 Unlock
Step: 3 Unlock