

Question: write a java program to display this information on the graph into a chart A java program that takes this information and make a table.
write a java program to display this information on the graph into a chart 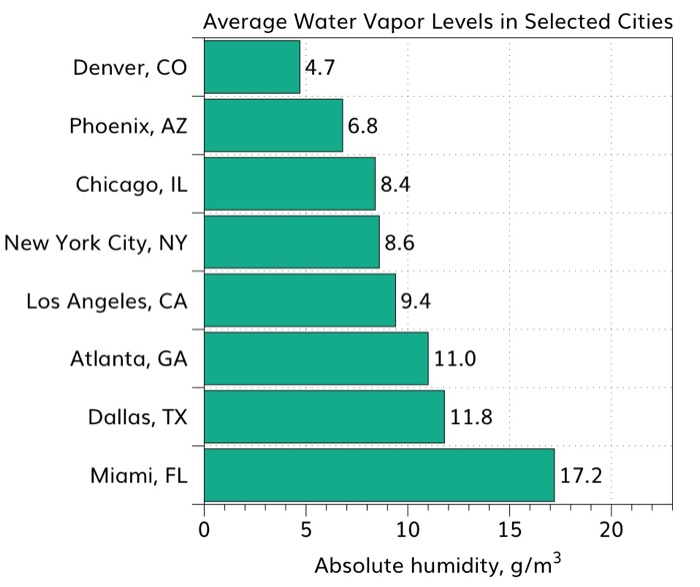
A java program that takes this information and make a table.
1. Title at top that says Average water level in selected cities
2. first row in the table should give the city name
3. second row should be the numbers from the chart that match the city
displays at a table like the following 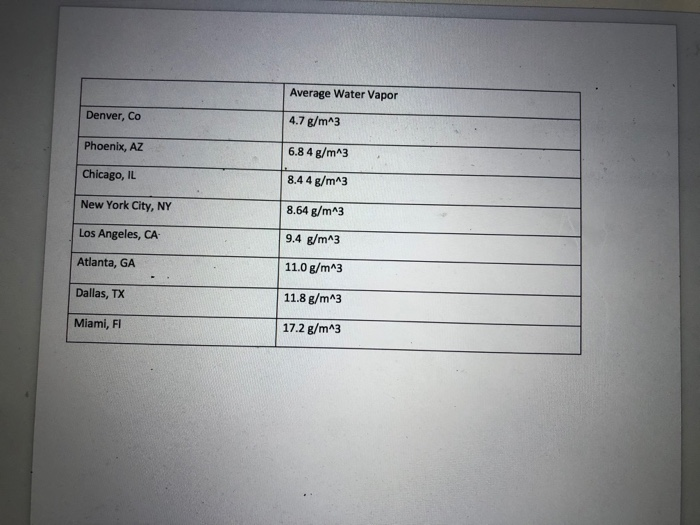
Average Water Vapor Levels in Selected Cities Denver, CO Phoenix, AZ Chicago, IL New York City, NY 8.6 Los Angeles, CA Atlanta, GA 11.0 Dallas, TX 11.8 Miami, FL 17.2 20 5 10 15 Absolute humidity, g/m Average Water Vapor Denver, Co 4.7 g/m^3 Phoenix, AZ 6.8 4 g/m^3 Chicago, IL 8.44 g/m^3 New York City, NY 8.64 g/m^3 Los Angeles, CA 9.4 g/m^3 Atlanta, GA 11.0 g/m^3 Dallas, TX 11.8 g/m^3 Miami, FI 17.2 g/m^3
Step by Step Solution
There are 3 Steps involved in it
1 Expert Approved Answer
Step: 1 Unlock

Question Has Been Solved by an Expert!
Get step-by-step solutions from verified subject matter experts
Step: 2 Unlock
Step: 3 Unlock