

Question: Write a MATLAB code (M-file) called plotfunc that does the following: o Receives the name of another MATLAB function as an input (e.g., user defined
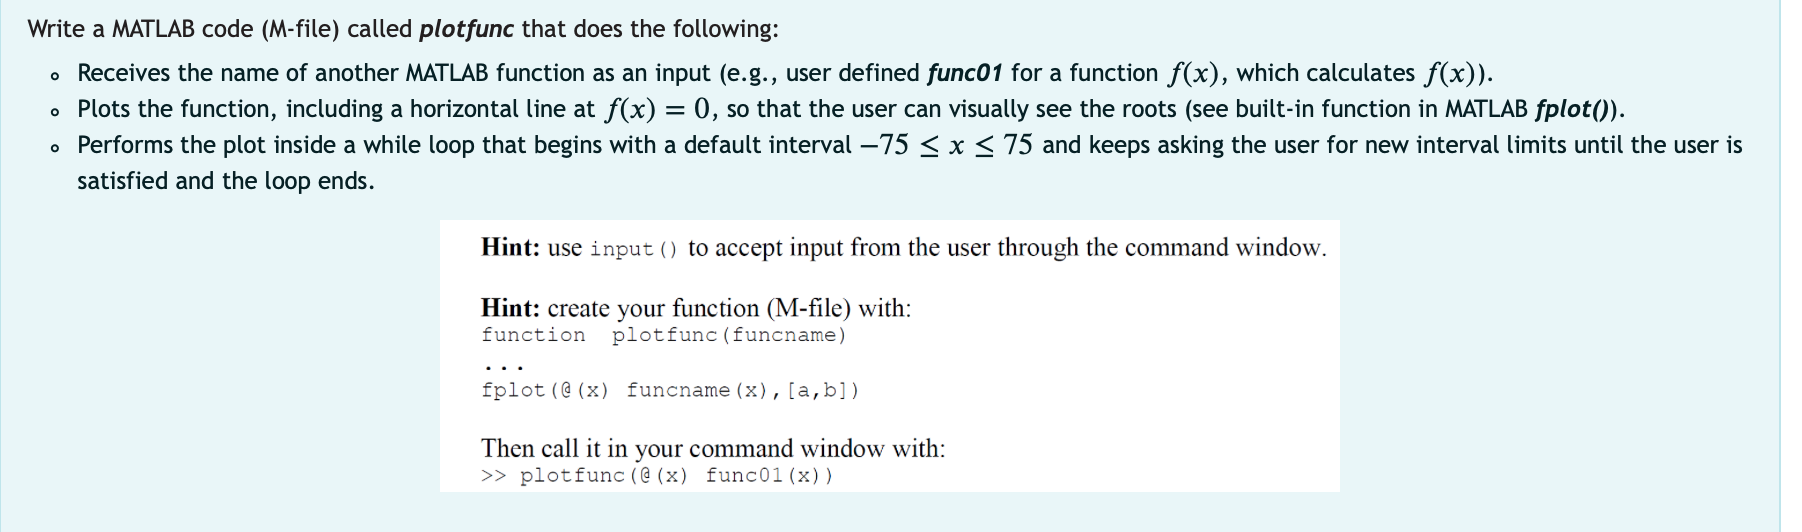
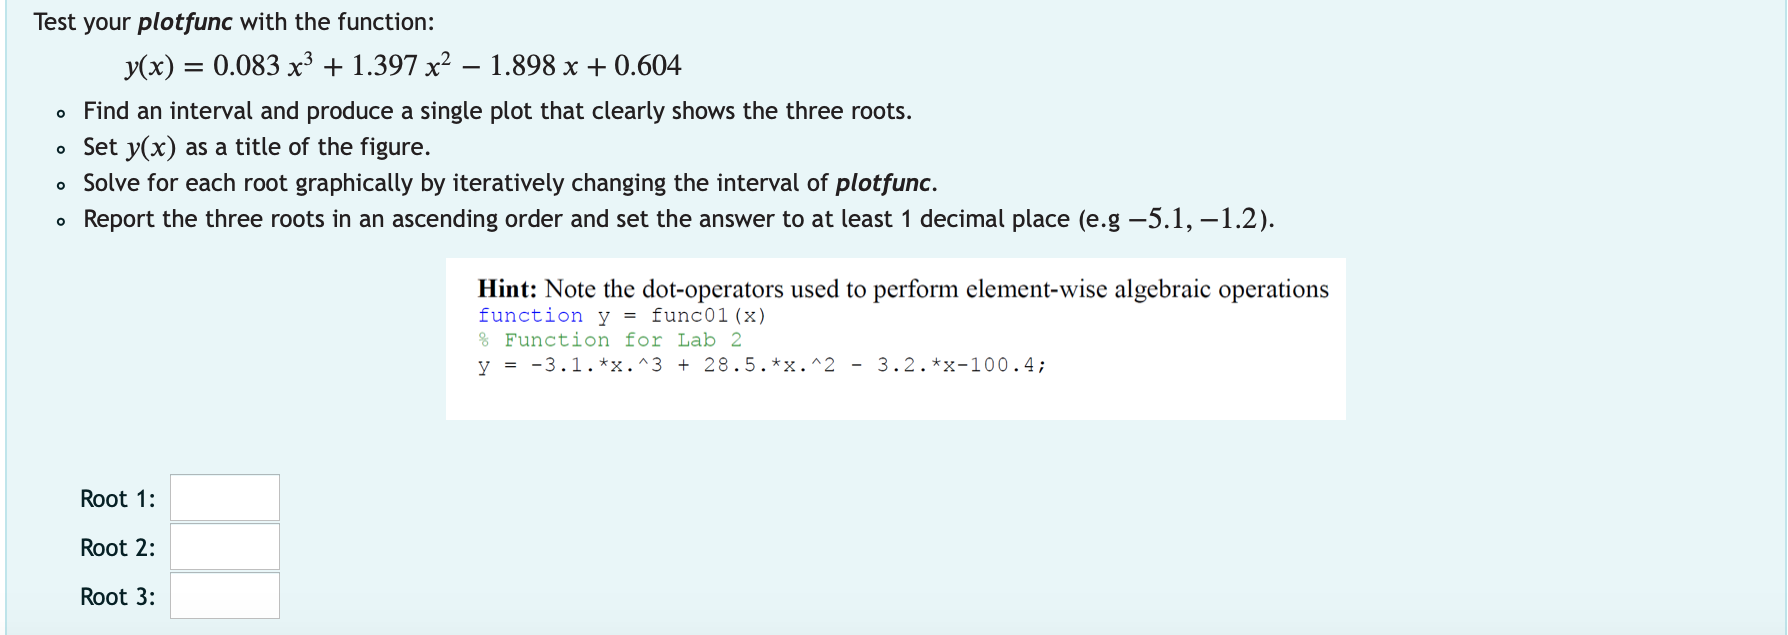
Write a MATLAB code (M-file) called plotfunc that does the following: o Receives the name of another MATLAB function as an input (e.g., user defined func01 for a function f(x), which calculates f(x)). o Plots the function, including a horizontal line at f(x) = 0, so that the user can visually see the roots (see built-in function in MATLAB fplot()). Performs the plot inside a while loop that begins with a default interval 75 > plotfunc (@ (x) func01(x)) Test your plotfunc with the function: y(x) = 0.083 x3 + 1.397 x2 1.898 x + 0.604 o Find an interval and produce a single plot that clearly shows the three roots. . Set y(x) as a title of the figure. Solve for each root graphically by iteratively changing the interval of plotfunc. Report the three roots in an ascending order and set the answer to at least 1 decimal place (e.g -5.1, -1.2). Hint: Note the dot-operators used to perform element-wise algebraic operations function y = func01 (x) % Function for Lab 2 y = -3.1.**.^3 + 28.5.*x.^2 - 3.2. *x-100.4; Root 1: Root 2: Root 3
Step by Step Solution
There are 3 Steps involved in it

Get step-by-step solutions from verified subject matter experts