

Question: Write a Matlab program to compute and plot the convolution between the following two signals: y(t) = x(t) *h(t) x(t) h(t) 1 2 t -3
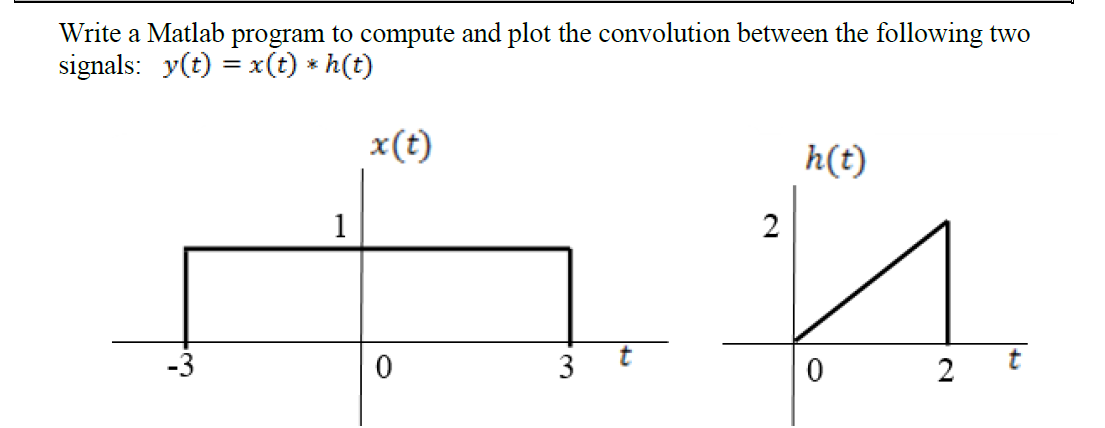
Write a Matlab program to compute and plot the convolution between the following two signals: y(t) = x(t) *h(t) x(t) h(t) 1 2 t -3 0 3 0 2 t
Step by Step Solution
There are 3 Steps involved in it
1 Expert Approved Answer
Step: 1 Unlock

Question Has Been Solved by an Expert!
Get step-by-step solutions from verified subject matter experts
Step: 2 Unlock
Step: 3 Unlock