

Question: Write a MATLAB program to generate a 30 surface plot (of the function (x, ) = x for the independent variable value ranges -30 SXS)
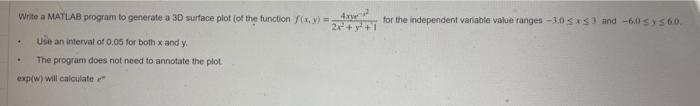
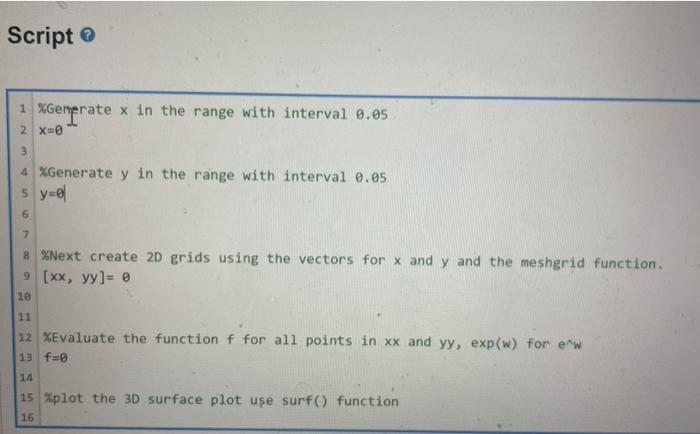
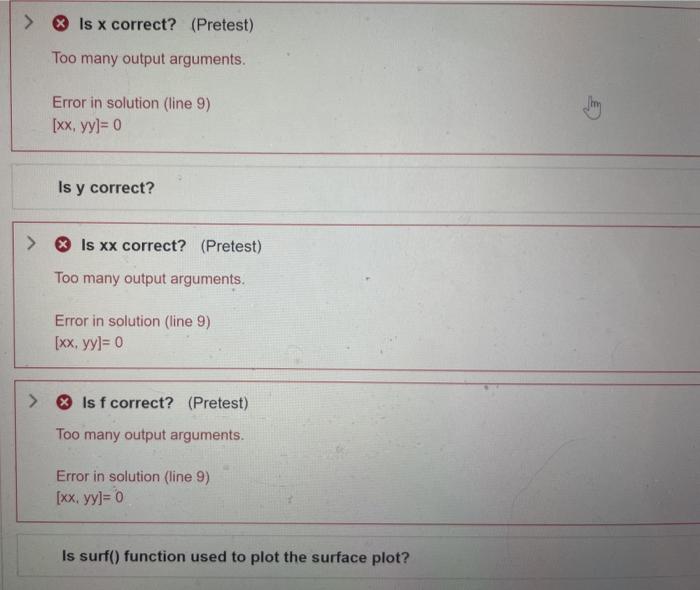
Write a MATLAB program to generate a 30 surface plot (of the function (x, ) = x for the independent variable value ranges -30 SXS) and -6.0 5 y 560 Use an interval of 0.05 for both x and y . The program does not need to annotate the plot exp/w) will calculate Script 1 %Generate x in the range with interval 0.05 2 X=0 3 4 %Generate y in the range with interval 0.05 5 y=el 6 1 7 8 %Next create 2D grids using the vectors for x and y and the meshgrid function. 9 [xx, yy)= 0 1e 11 12 XEvaluate the function f for all points in xx and yy, exp(w) for ew 13 f=0 14 15 Xplot the 3D surface plot use surf() function 16 Is x correct? (Pretest) Too many output arguments. Error in solution (line 9) [xx, yy)= 0 Is y correct? > Is xx correct? (Pretest) Too many output arguments. Error in solution (line 9) [xx, yy)= 0 > Is f correct? (Pretest) Too many output arguments. Error in solution (line 9) [xx,yyl=0 Is surf() function used to plot the surface plot
Step by Step Solution
There are 3 Steps involved in it

Get step-by-step solutions from verified subject matter experts