

Question: Write a MATLAB script file that generates a vector named x that contains the Fourier Series shown below for the terms n = 1,
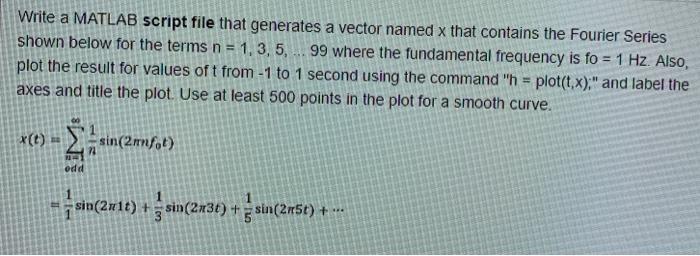
Write a MATLAB script file that generates a vector named x that contains the Fourier Series shown below for the terms n = 1, 3, 5, 99 where the fundamental frequency is fo= 1 Hz. Also, plot the result for values of t from -1 to 1 second using the command "h=plot(t,x)," and label the axes and title the plot. Use at least 500 points in the plot for a smooth curve. x(t) odd sin(2mmfot) sin(2x1t) + sin(2x31) sin(2x3t)+sin(2x5t) +
Step by Step Solution
There are 3 Steps involved in it
1 Expert Approved Answer
Step: 1 Unlock

Question Has Been Solved by an Expert!
Get step-by-step solutions from verified subject matter experts
Step: 2 Unlock
Step: 3 Unlock