

Question: Write a MATLAB script that plots the even and odd components of the functions in problem parts(a)(c)(d)(f)(h)(i). This script will result in three figures, each
Write a MATLAB script that plots the even and odd components of the functions in problem parts(a)(c)(d)(f)(h)(i). This script will result in three figures, each containing two columns, where each column will display three figure axes: top axis original function; middle axis the functions even component; bottom axis the functions odd component. Use the MATLABsubplot() function to create these axis layouts,and add descriptive titles and labels to your plots. For example, the left column of the first figure should contain plots of g(t),ge(t), and go(t), from top to bottom, for problem (a). Use the title of the top axis to state the problem number and the mathematical expression for g(t). Then, use the titles of the remaining axes to identify the even and odd signal components. The right column of the first figure should contain the corresponding plots for problem(c). The second figure should address (d)(f), and the third figure should address (h)(i).
The functions to be plotted are in the image.
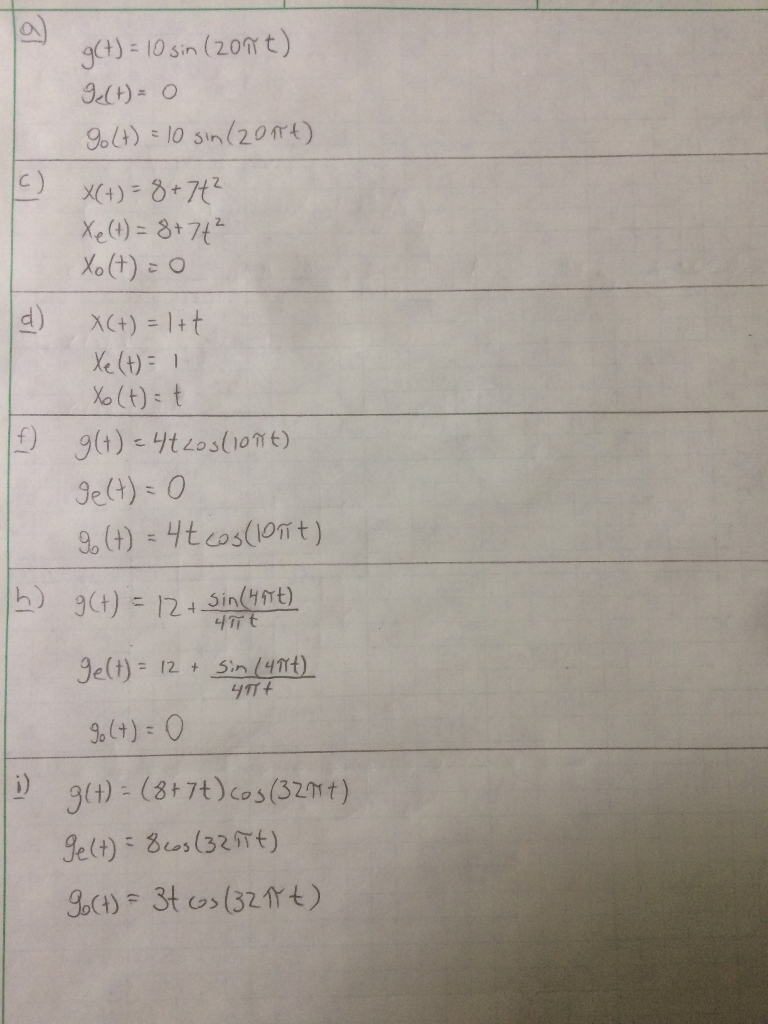
10 sin(2 d) x(+) = 1+t Xe (t 1 Yo(t): t 4r t j) g(t)-(3+7t)cos(3201 t)
Step by Step Solution
There are 3 Steps involved in it

Get step-by-step solutions from verified subject matter experts