

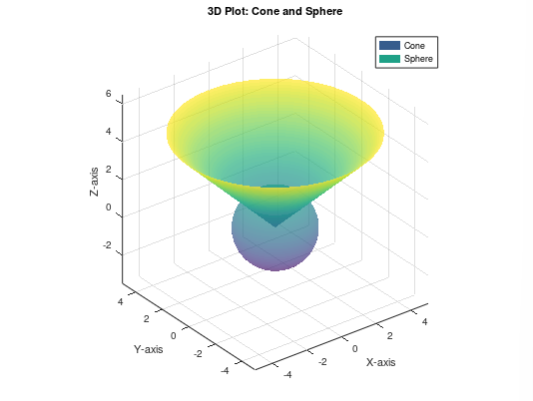
Question: Write a MATLAB script to generate a 3 D plot of a Cone and Sphere in the same graph. Plot a cone and a sphere
Write a MATLAB script to generate a D plot of a "Cone and Sphere" in the same graph. Plot a cone and a sphere on the same set of axes. The parametric equations for a cone and a sphere are given by:
Cone:
xuvucosv
yuvusinv
zuvu
Sphere:
xuvRsinucosv
yuvRsinusinv
zuvRcosu
Use the following parameters:
For the cone u in the range and v in the range pi
For the sphere u in the range pi and v in the range pi
For both shapes: R
Include labels for the axes and a title for the plot.
Step by Step Solution
There are 3 Steps involved in it
1 Expert Approved Answer
Step: 1 Unlock

Question Has Been Solved by an Expert!
Get step-by-step solutions from verified subject matter experts
Step: 2 Unlock
Step: 3 Unlock