

Question: write a paragraph (200 words +) depicting the graph and what you see in the numbers/trends Stock Price Record: Fiscal Years 2015 2016 Years 2017
write a paragraph (200 words +) depicting the graph and what you see in the numbers/trends
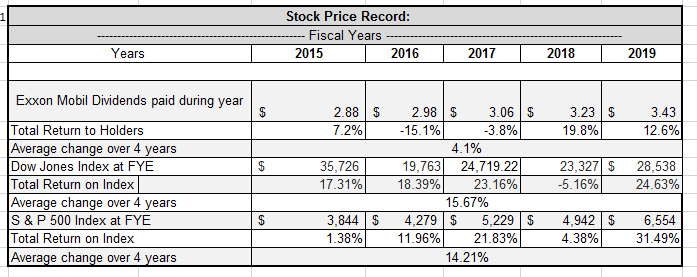
Stock Price Record: Fiscal Years 2015 2016 Years 2017 2018 2019 Exxon Mobil Dividends paid during year $ 2.88 $ 7.2% 3.23 $ 19.8% 3.43 12.6% $ 35,726 17.31% 2.98 $ 3.06 $ -15.1% -3.8% 4.1% 19,763 24,719.22 18.39% 23.16% 15.67% 4,279 $ 5,229 $ 11.96% 21.83% 14.21% 23,327 $ -5.16% Total Return to Holders Average change over 4 years Dow Jones Index at FYE Total Return on Index Average change over 4 years S&P 500 Index at FYE Total Return on Index Average change over 4 years 28,538 24.63% $ 3,844 $ 1.38% 4,942 $ 4.38% 6,554 31.49%
Step by Step Solution
There are 3 Steps involved in it
1 Expert Approved Answer
Step: 1 Unlock

Question Has Been Solved by an Expert!
Get step-by-step solutions from verified subject matter experts
Step: 2 Unlock
Step: 3 Unlock