

Question: Write a program in python to calculate and plot the position and the velocity of a linear piston connected to a crank through a connecting
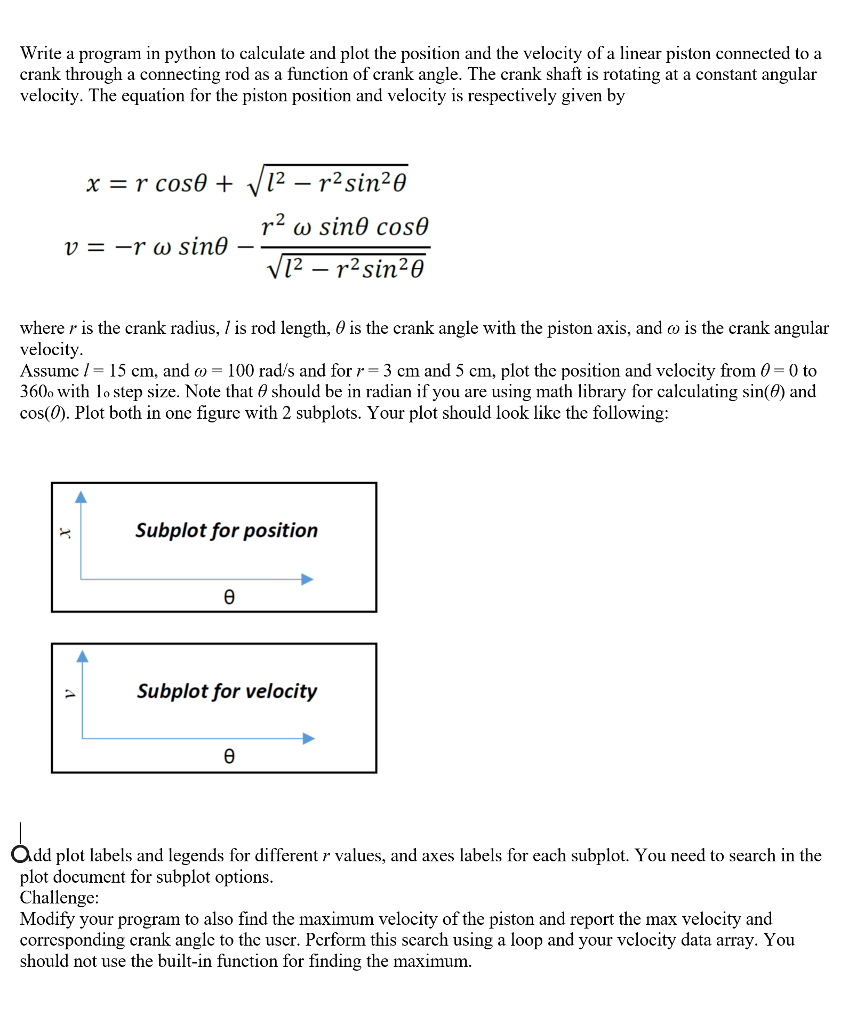
Write a program in python to calculate and plot the position and the velocity of a linear piston connected to a crank through a connecting rod as a function of crank angle. The crank shaft is rotating at a constant angular velocity. The equation for the piston position and velocity is respectively given by 12-r2 sin2 where r is the crank radius, l is rod length, is the crank angle with the piston axis, and o is the crank angular velocity Assume 1-15 cm, and -100 rads and for r-3 cm and 5 cm, plot the position and velocity from 0-0 to 360 with lo step size. Note that should be in radian if you are using math library for calculating sin()and cos(0). Plot both in one figure with 2 subplots. Your plot should look like the following: HSubplot for position Subplot for velocity Qdd plot labels and legends for different r values, and axes labels for each subplot. You need to search in the plot document for subplot options. Challenge: Modify your program to also find the maximum velocity of the piston and report the max velocity and corresponding crank angle to the uscrPerform this search using a loop and your velocity data array. You should not use the built-in function for finding the maximum Write a program in python to calculate and plot the position and the velocity of a linear piston connected to a crank through a connecting rod as a function of crank angle. The crank shaft is rotating at a constant angular velocity. The equation for the piston position and velocity is respectively given by 12-r2 sin2 where r is the crank radius, l is rod length, is the crank angle with the piston axis, and o is the crank angular velocity Assume 1-15 cm, and -100 rads and for r-3 cm and 5 cm, plot the position and velocity from 0-0 to 360 with lo step size. Note that should be in radian if you are using math library for calculating sin()and cos(0). Plot both in one figure with 2 subplots. Your plot should look like the following: HSubplot for position Subplot for velocity Qdd plot labels and legends for different r values, and axes labels for each subplot. You need to search in the plot document for subplot options. Challenge: Modify your program to also find the maximum velocity of the piston and report the max velocity and corresponding crank angle to the uscrPerform this search using a loop and your velocity data array. You should not use the built-in function for finding the maximum
Step by Step Solution
There are 3 Steps involved in it

Get step-by-step solutions from verified subject matter experts