

Question: Write a script in MATLAB to plot the vertical component of the ground reaction force and the vertical (Y) position of the heel marker for
Write a script in MATLAB to plot the vertical component of the ground reaction force and the vertical (Y) position of the heel marker for a complete gait cycle (i.e. heel strike to heel strike on a 0-100% scale) on the same chart (with two Y-axis) as below. Be sure to include a title on the chart and label the axes as seen in the figure below. Next, determine the maximum value of the ground reaction force and plot on the same chart using a red square as a marker. NOTE: The first heel strike occurs in frame 28 and the second in frame 97. Also, the name of the comma separated variable file containing the motion capture data is WinterData.csv (ALSO PROVIDED BELOW).
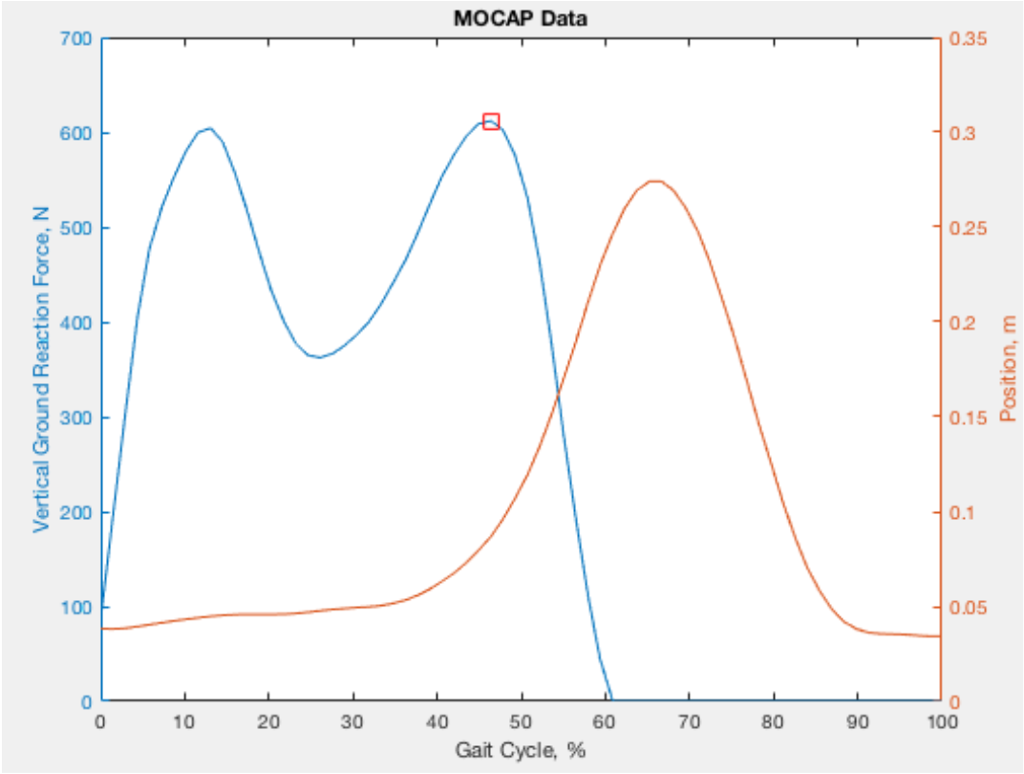
Figure 1 (above): MOCAP Data Plot of what the script should produce
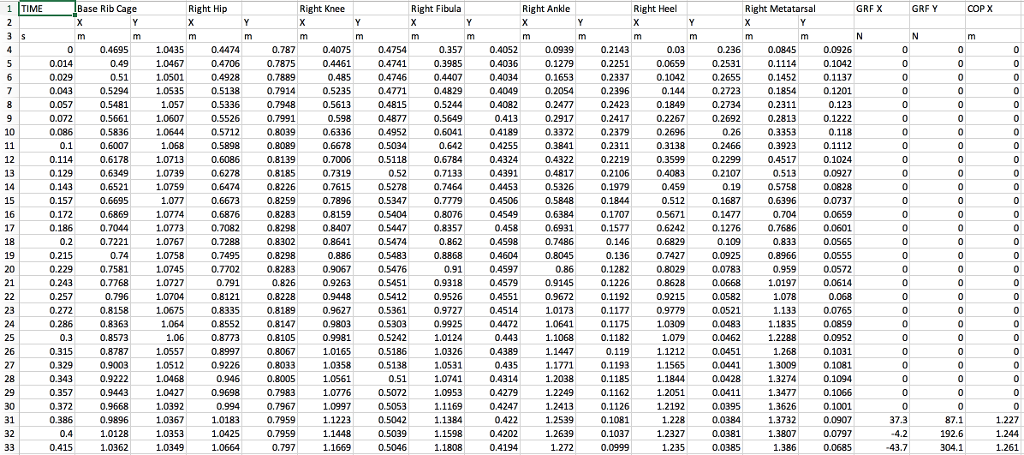
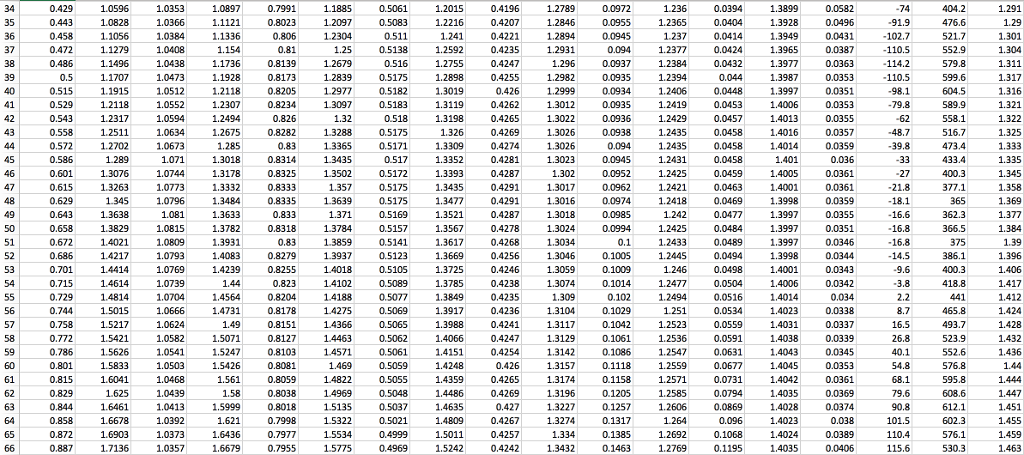
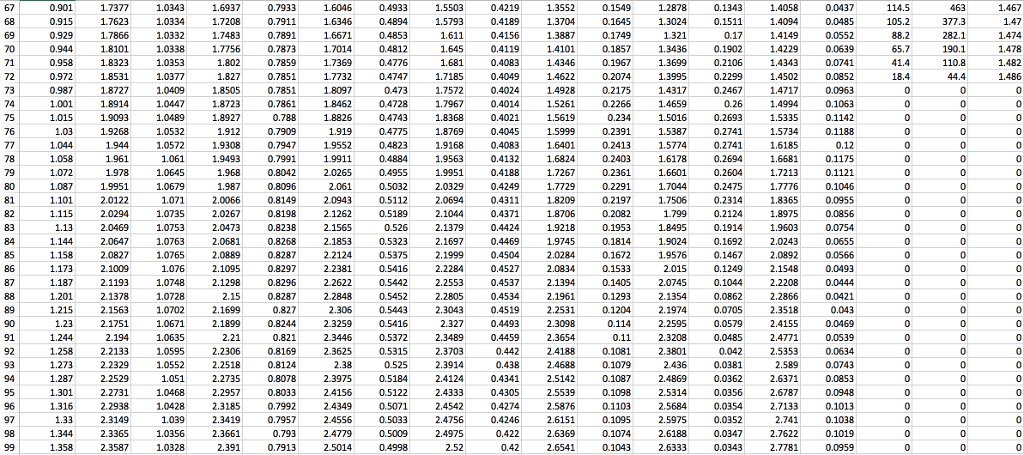
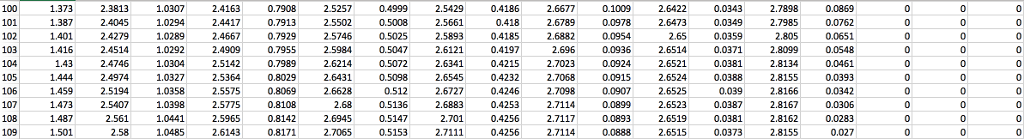
Figure 2 (above): Complete WinterData.csv data
HINTS: Normalise time to percent of gait cycle (0-100%) and use the command yyaxis for activating left or right y-axis. Do not forget the marker as shown in Figure 1.
CSV FILE: https://www.dropbox.com/s/ymj6ipsbxpjs0qi/WinterData.csv?dl=0
MOCAP Data 700 0.35 600 0.3 500 025 400 02 E 300 0.15 200 0.1 100 0.05 0 0 10 20 30 40 50 60 70 80 90 100 Gait Cycle, 96 MOCAP Data 700 0.35 600 0.3 500 025 400 02 E 300 0.15 200 0.1 100 0.05 0 0 10 20 30 40 50 60 70 80 90 100 Gait Cycle, 96
Step by Step Solution
There are 3 Steps involved in it

Get step-by-step solutions from verified subject matter experts