

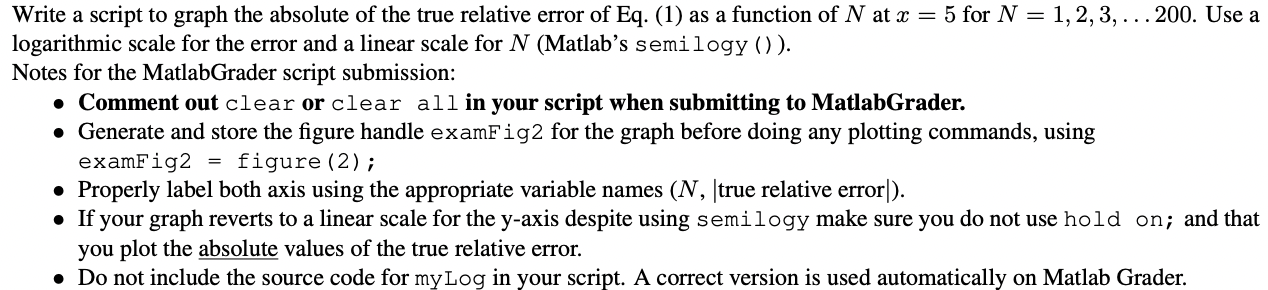
Question: Write a script to graph the absolute of the true relative error of Eq . ( 1 ) as a function of N at x
Write a script to graph the absolute of the true relative error of Eq as a function of at for dots Use a
logarithmic scale for the error and a linear scale for Matlabs semilogy
Notes for the MatlabGrader script submission:
Comment out clear or clear all in your script when submitting to MatlabGrader.
Generate and store the figure handle examFig for the graph before doing any plotting commands, using
examFig figure ;
Properly label both axis using the appropriate variable names true relative error
If your graph reverts to a linear scale for the yaxis despite using semilogy make sure you do not use hold on; and that
you plot the absolute values of the true relative error.
Do not include the source code for myLog in your script. A correct version is used automatically on Matlab Grader.
Step by Step Solution
There are 3 Steps involved in it
1 Expert Approved Answer
Step: 1 Unlock

Question Has Been Solved by an Expert!
Get step-by-step solutions from verified subject matter experts
Step: 2 Unlock
Step: 3 Unlock