

Question: Write a script to graph the absolute of the true relative error of Eq . ( I ) as a function of N at x
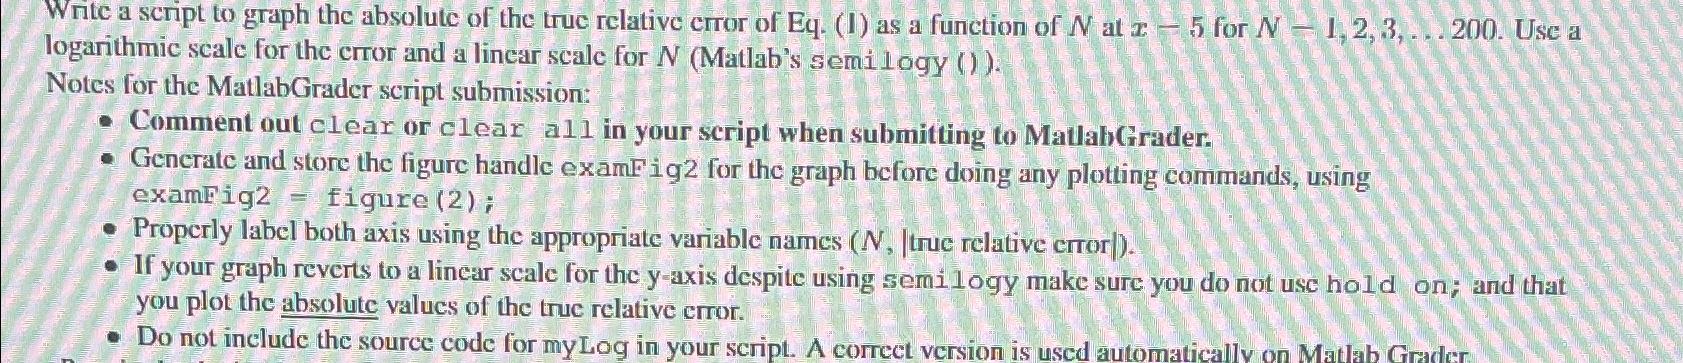
Write a script to graph the absolute of the true relative error of EqI as a function of at for N Use a logarithmic scale for the error and a linear scale for Matlabs semilogy
Generate and store the figure handle examFig for the graph before doing any plotting commands, using examFig figure ;
Properly label both axis using the appropriate variable names true relative error
If your graph reverts to a linear scale for the axis despite using semilogy make sure you do not use hold on; and that you plot the absolute values of the true relative error.
Do not include the source code for myLog in your script. A correct version is used automatically on Matlab Grader
Step by Step Solution
There are 3 Steps involved in it
1 Expert Approved Answer
Step: 1 Unlock

Question Has Been Solved by an Expert!
Get step-by-step solutions from verified subject matter experts
Step: 2 Unlock
Step: 3 Unlock