

Question: Write a short conclusion synthesizing your work in Problems 3 and 4. What do the graphical displays and descriptive statistics suggest about the data? How
Write a short conclusion synthesizing your work in Problems 3 and 4. What do the graphical displays and descriptive statistics suggest about the data? How do these items provide additional insight into the statistical questions that you posed in Problem 2
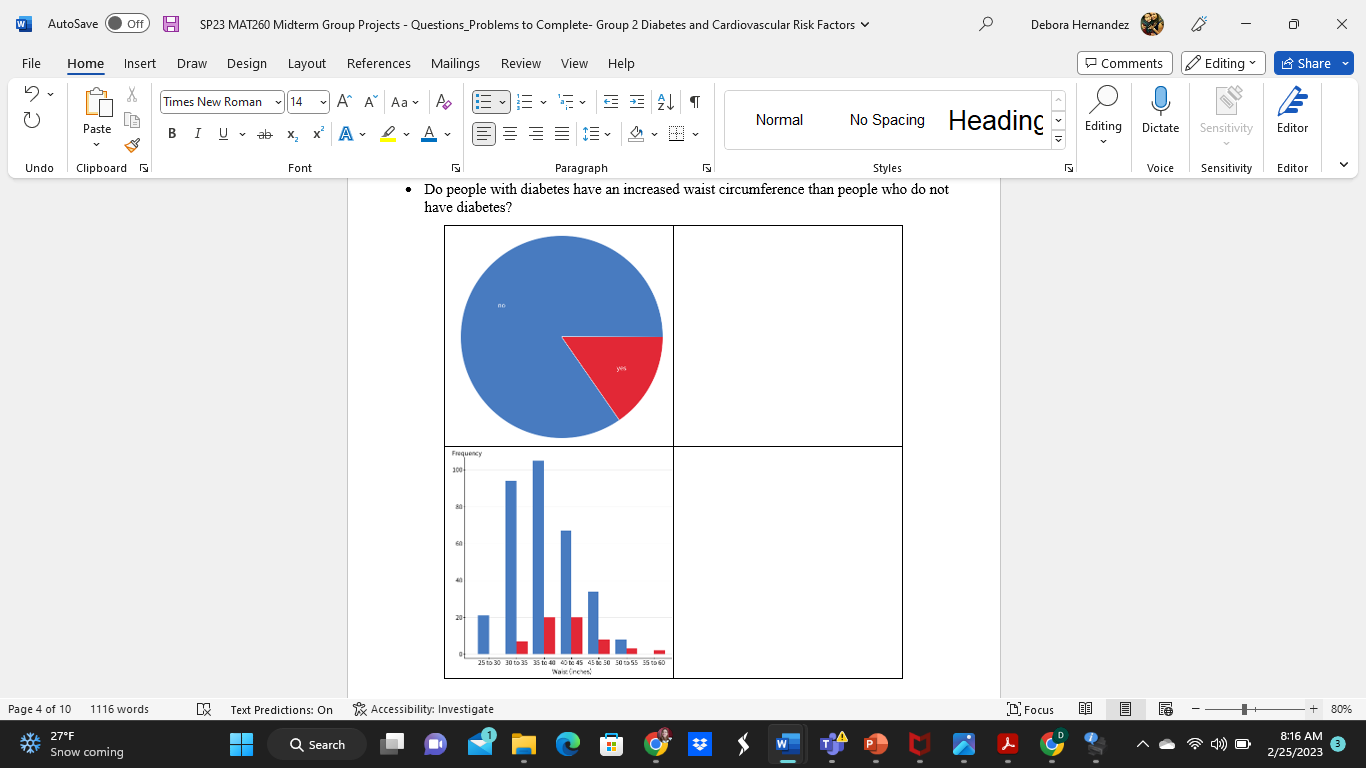
W AutoSave @ Off SP23 MAT260 Midterm Group Projects - Questions_Problems to Complete- Group 2 Diabetes and Cardiovascular Risk Factors v Debora Hernandez X File Home Insert Draw Design Layout References Mailings Review View Help Comments Editing Share G Times New Roman 14 A A Aa Ap O Normal Paste X X A LA Spacing Heading Editing Editor BIUab Dictate Sensitivity Undo Clipboard Font Paragraph Styles Voice Sensitivity Editor Do people with diabetes have an increased waist circumference than people who do not have diabetes? Frequency 100 25 to 30 30 to 35 35 to -40 43 be 45 45 82 50 50 03 55 56 15 60 wate (rexes) Page 4 of 10 1116 words Text Predictions: On X Accessibility: Investigate [ Focus + 80% 27'F P 8:16 AM Q Search W Snow coming 2/25/2023 3
Step by Step Solution
There are 3 Steps involved in it

Get step-by-step solutions from verified subject matter experts