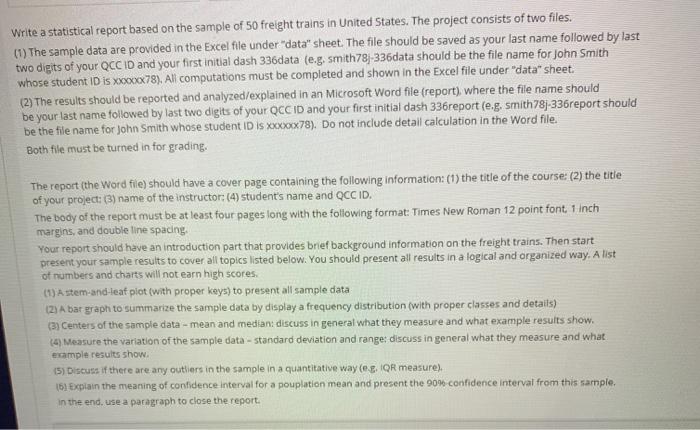
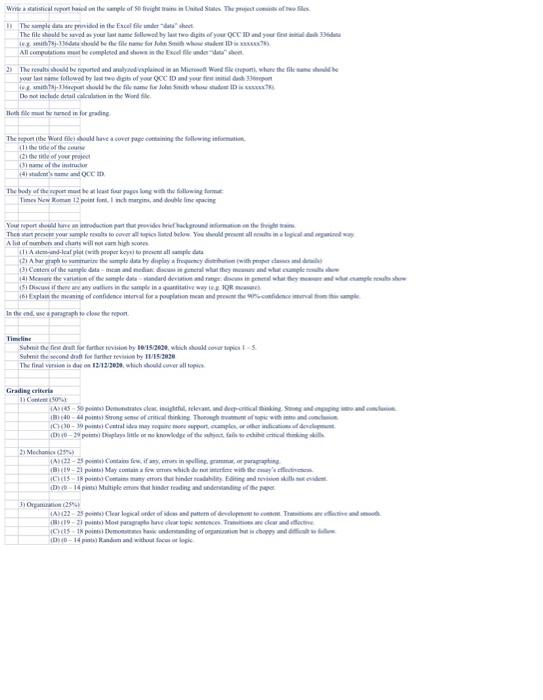
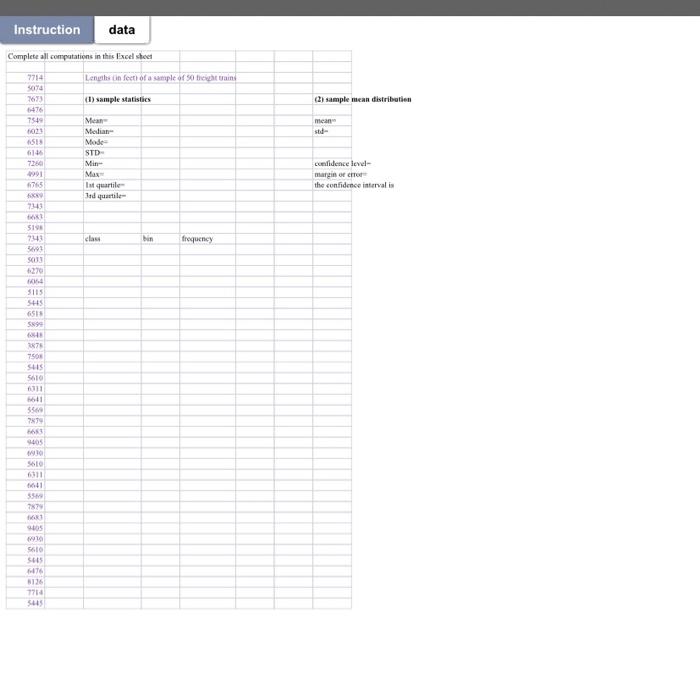
Question: Write a statistical report based on the sample of 50 freight trains in United States. The project consists of two files. (1) The sample data

Write a statistical report based on the sample of
Write a statistical report based on the sample of 50 freight trains in United States. The project consists of two files. (1) The sample data are provided in the Excel file under "data" sheet. The file should be saved as your last name followed by last two digits of your QCC ID and your first initial dash 336data (e.g. smith783-336data should be the file name for John Smith whose student ID is Xooox78). All computations must be completed and shown in the Excel file under "data" sheet. (2) The results should be reported and analyzed/explained in an Microsoft Word file (report), where the file name should be your last name followed by last two digits of your QCCID and your first initial dash 336report (e.g. smith 78j-336report should be the file name for John Smith whose student ID is xxx>00x78). Do not include detail calculation in the Word file. Both file must be turned in for grading. The report (the Word file) should have a cover page containing the following information: (1) the title of the course (2) the title of your project: (3) name of the instructor: (4) student's name and QCCID. The body of the report must be at least four pages long with the following format: Times New Roman 12 point font. 1 inch margins, and double tine spacing. Your report should have an introduction part that provides brief background information on the freight trains. Then start present your sample results to cover all topics listed below. You should present all results in a logical and organized way. A list of numbers and charts will not earn high scores (1) Astem-and-leaf piot (with proper keys) to present all sample data (2) A bar graph to summarize the sample data by display a frequency distribution (with proper classes and details) (3) Centers of the sample data - mean and median: discuss in general what they measure and what example results show. (4) Measure the variation of the sample data - standard deviation and range: discuss in general what they measure and what example results show (5) Discuss if there are any outliers in the sample in a quantitative way (eg, QR measure). 161 Explain the meaning of confidence interval for a pouplation mean and present the 90% confidence interval from this sample. In the end. use a paragraph to close the report. Instruction data Complete all computations in this lince sheet Lengths in feet of a sample of 50 height rain 2714 saya 7633 1476 754 (1) sample statistics (3) sample mean distribution mean sh S 7264 1991 765 Mean Median Mode STD- Min Max Lot quartile Tadquartile confidence level margin or cho the confidence interval is 7443 519 7343 Class frequency SO 270 3115 SUS GSIS 59 275 750 SUS 5610 55 1405 w Sot 6811 41 550 774 05 10 5610 SUS 04 5136 7714 su Write a statistical report based on the sample of 50 freight trains in United States. The project consists of two files. (1) The sample data are provided in the Excel file under "data" sheet. The file should be saved as your last name followed by last two digits of your QCC ID and your first initial dash 336data (e.g. smith783-336data should be the file name for John Smith whose student ID is Xooox78). All computations must be completed and shown in the Excel file under "data" sheet. (2) The results should be reported and analyzed/explained in an Microsoft Word file (report), where the file name should be your last name followed by last two digits of your QCCID and your first initial dash 336report (e.g. smith 78j-336report should be the file name for John Smith whose student ID is xxx>00x78). Do not include detail calculation in the Word file. Both file must be turned in for grading. The report (the Word file) should have a cover page containing the following information: (1) the title of the course (2) the title of your project: (3) name of the instructor: (4) student's name and QCCID. The body of the report must be at least four pages long with the following format: Times New Roman 12 point font. 1 inch margins, and double tine spacing. Your report should have an introduction part that provides brief background information on the freight trains. Then start present your sample results to cover all topics listed below. You should present all results in a logical and organized way. A list of numbers and charts will not earn high scores (1) Astem-and-leaf piot (with proper keys) to present all sample data (2) A bar graph to summarize the sample data by display a frequency distribution (with proper classes and details) (3) Centers of the sample data - mean and median: discuss in general what they measure and what example results show. (4) Measure the variation of the sample data - standard deviation and range: discuss in general what they measure and what example results show (5) Discuss if there are any outliers in the sample in a quantitative way (eg, QR measure). 161 Explain the meaning of confidence interval for a pouplation mean and present the 90% confidence interval from this sample. In the end. use a paragraph to close the report. Instruction data Complete all computations in this lince sheet Lengths in feet of a sample of 50 height rain 2714 saya 7633 1476 754 (1) sample statistics (3) sample mean distribution mean sh S 7264 1991 765 Mean Median Mode STD- Min Max Lot quartile Tadquartile confidence level margin or cho the confidence interval is 7443 519 7343 Class frequency SO 270 3115 SUS GSIS 59 275 750 SUS 5610 55 1405 w Sot 6811 41 550 774 05 10 5610 SUS 04 5136 7714 su

Step by Step Solution

There are 3 Steps involved in it

1 Expert Approved Answer
Step: 1 Unlock blur-text-image
Question Has Been Solved by an Expert!

Get step-by-step solutions from verified subject matter experts

Step: 2 Unlock
Step: 3 Unlock

Students Have Also Explored These Related General Management Questions!