Question: write a what if analyse base on following data 2 WHAT IF ANALYSIS 2.1 That is the BEP if the total fixed costs are increased
write a what if analyse base on following data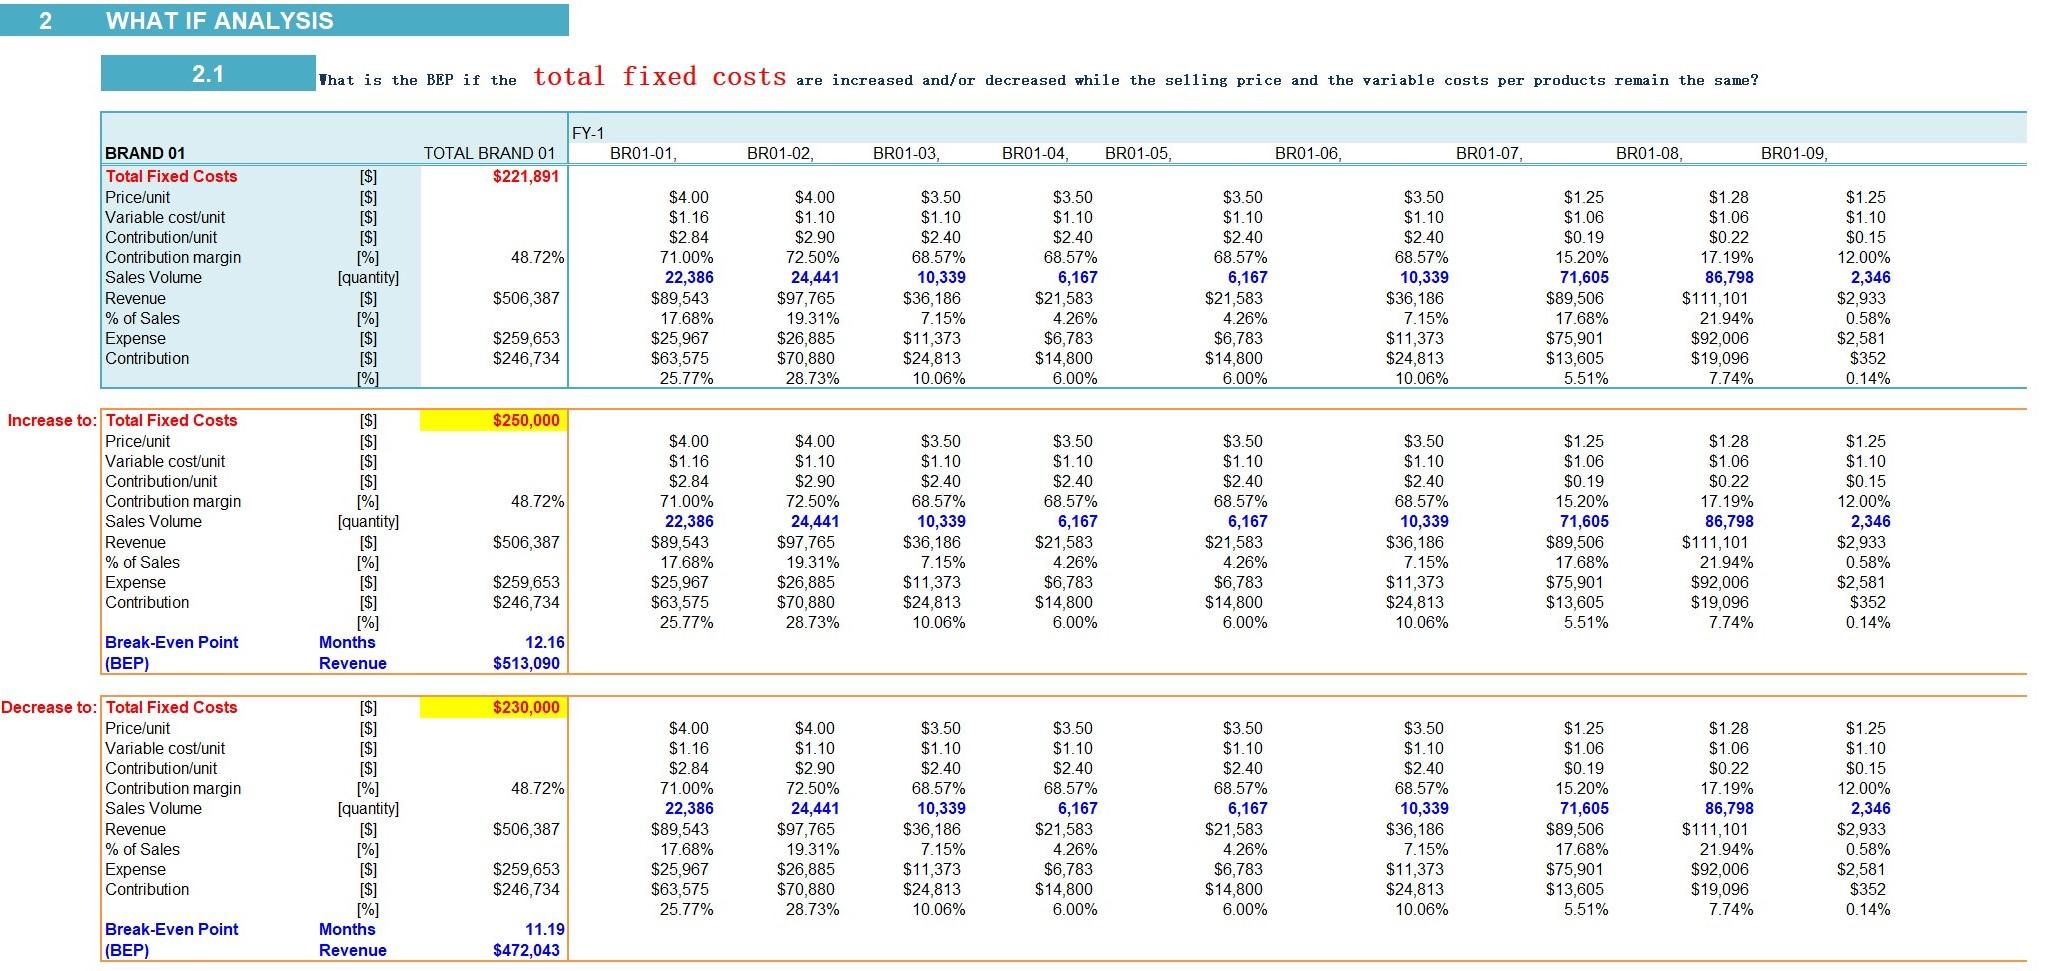
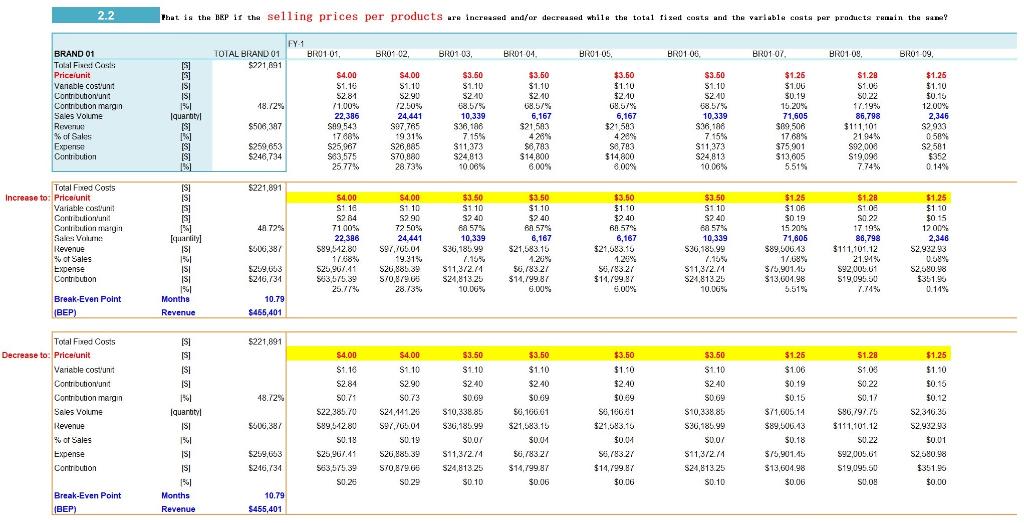
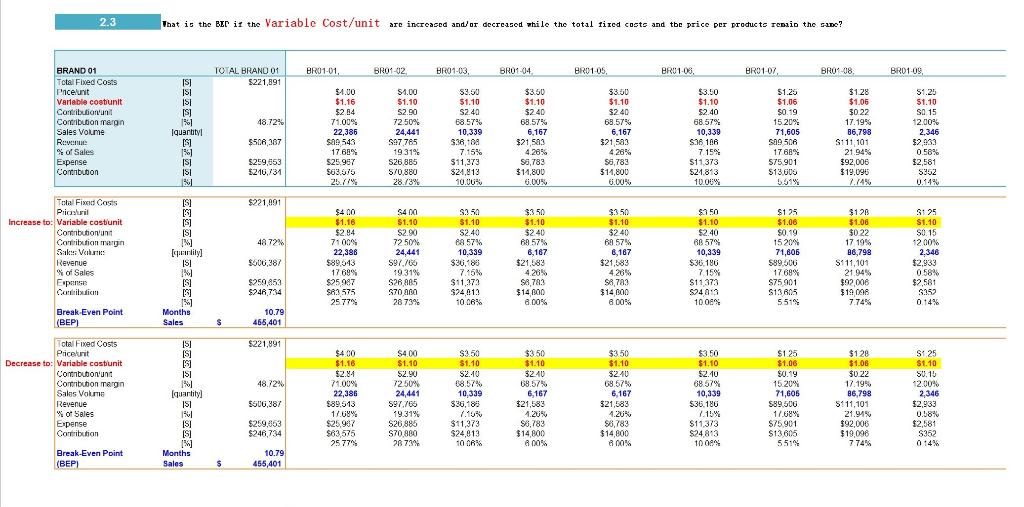
2 WHAT IF ANALYSIS 2.1 That is the BEP if the total fixed costs are increased and/or decreased while the selling price and the variable costs per products remain the same? FY-1 BR01-01, BR01-02 BR01-03, BR01-04, BR01-05, BR01-06 BR01-07 BR01-08 BRO1-09, TOTAL BRAND 01 $221,891 [$] [$] BRAND 01 Total Fixed Costs Price/unit Variable cost/unit Contribution/unit Contribution margin Sales Volume Revenue % of Sales Expense Contribution 48.72% [quantity] $4.00 $1.16 $2.84 71.00% 22,386 $89,543 17.68% $25,967 $63,575 25.77% $4.00 $1.10 $2.90 72.50% 24,441 $97,765 19.31% $26,885 $70,880 28.73% $3.50 $1.10 $2.40 68.57% 10,339 $36,186 7.15% $11,373 $24,813 10.06% $3.50 $1.10 $2.40 68.57% 6,167 $21,583 4.26% $6,783 $14,800 6.00% $3.50 $1.10 $2.40 68.57% 6,167 $21,583 4.26% $6,783 $14,800 6.00% $3.50 $1.10 $2.40 68.57% 10,339 $36,186 7.15% $11,373 $24,813 10.06% $1.25 $1.06 $0.19 15.20% 71,605 $89,506 17.68% $75,901 $13,605 5.51% $1.28 $1.06 $0.22 17.19% 86,798 $111,101 21.94% $92,006 $19,096 7.74% $1.25 $1.10 $0.15 12.00% 2,346 $2,933 0.58% $2,581 $352 0.14% $506,387 $259,653 $246,734 $250,000 Increase to: Total Fixed Costs Price/unit Variable cost/unit Contribution/unit Contribution margin Sales Volume Revenue % of Sales Expense Contribution zzzzzz zzzzzazoaz 48.72% [quantity] $4.00 $1.16 $2.84 71.00% 22,386 $89,543 17.68% $25,967 $63,575 25.77% $4.00 $1.10 $2.90 72.50% 24,441 $97,765 19.31% $26,885 $70,880 28.73% $3.50 $1.10 $2.40 68.57% 10,339 $36,186 7.15% $11,373 $24,813 10.06% $3.50 $1.10 $2.40 68.57% 6,167 $21,583 4.26% $6,783 $14,800 6.00% $3.50 $1.10 $2.40 68.57% 6,167 $21,583 4.26% $6,783 $14,800 6.00% $3.50 $1.10 $2.40 68.57% 10,339 $36,186 7.15% $11,373 $24,813 10.06% $1.25 $1.06 $0.19 15.20% 71,605 $89,506 17.68% $75,901 $13,605 5.51% $1.28 $1.06 $0.22 17.19% 86,798 $111,101 21.94% $92,006 $19,096 7.74% $1.25 $1.10 $0.15 12.00% 2,346 $2,933 0.58% $2,581 $352 0.14% $506,387 $259,653 $246,734 Break-Even Point (BEP) Months Revenue 12.16 $513,090 $230,000 Decrease to: Total Fixed Costs Price/unit Variable cost/unit Contribution/unit Contribution margin Sales Volume Revenue % of Sales Expense Contribution [$] [$] [$] [$] [%] [quantity] [$] 48.72% $4.00 $1.16 $2.84 71.00% 22,386 $89,543 17.68% $25,967 $63,575 25.77% $4.00 $1.10 $2.90 72.50% 24,441 $97,765 19.31% $26,885 $70,880 28.73% $3.50 $1.10 $2.40 68.57% 10,339 $36,186 7.15% $11,373 $24,813 10.06% $3.50 $1.10 $2.40 68.57% 6,167 $21,583 4.26% $6,783 $14,800 6.00% $3.50 $1.10 $2.40 68.57% 6,167 $21,583 4.26% $6,783 $14,800 6.00% $3.50 $1.10 $2.40 68.57% 10,339 $36,186 7.15% $11,373 $24,813 10.06% $1.25 $1.06 $0.19 15.20% 71,605 $89,506 17.68% $75,901 $13,605 5.51% $1.28 $1.06 $0.22 17.19% 86,798 $111,101 21.94% $92,006 $19,096 7.74% $1.25 $1.10 $0.15 12.00% 2,346 $2,933 0.58% $2,581 $352 0.14% $506,387 $259,653 $246,734 Break-Even Point (BEP) [$] [%] Months Revenue 11.19 $472,043 2 ta the if the selling prices per products TOTAL BRAND 01 BR01-01, BRO105, BR01 00 BRO1 07. BRU10 BROT 09, Plarities 91 207201222 2223327433 z ! **222fil 216 48 29% That is the BC ir the Variable Cost/unit are increased and/or decreased while the costs and the price per products remain the same TOTAL BRAND 01 $221,89 | Ble01 01. | BB0 H0014 ) | BBU 14 Bill 1, | ETt13 | His 107. SHOP 18. E801 casternate = Social are m 494 2 WHAT IF ANALYSIS 2.1 That is the BEP if the total fixed costs are increased and/or decreased while the selling price and the variable costs per products remain the same? FY-1 BR01-01, BR01-02 BR01-03, BR01-04, BR01-05, BR01-06 BR01-07 BR01-08 BRO1-09, TOTAL BRAND 01 $221,891 [$] [$] BRAND 01 Total Fixed Costs Price/unit Variable cost/unit Contribution/unit Contribution margin Sales Volume Revenue % of Sales Expense Contribution 48.72% [quantity] $4.00 $1.16 $2.84 71.00% 22,386 $89,543 17.68% $25,967 $63,575 25.77% $4.00 $1.10 $2.90 72.50% 24,441 $97,765 19.31% $26,885 $70,880 28.73% $3.50 $1.10 $2.40 68.57% 10,339 $36,186 7.15% $11,373 $24,813 10.06% $3.50 $1.10 $2.40 68.57% 6,167 $21,583 4.26% $6,783 $14,800 6.00% $3.50 $1.10 $2.40 68.57% 6,167 $21,583 4.26% $6,783 $14,800 6.00% $3.50 $1.10 $2.40 68.57% 10,339 $36,186 7.15% $11,373 $24,813 10.06% $1.25 $1.06 $0.19 15.20% 71,605 $89,506 17.68% $75,901 $13,605 5.51% $1.28 $1.06 $0.22 17.19% 86,798 $111,101 21.94% $92,006 $19,096 7.74% $1.25 $1.10 $0.15 12.00% 2,346 $2,933 0.58% $2,581 $352 0.14% $506,387 $259,653 $246,734 $250,000 Increase to: Total Fixed Costs Price/unit Variable cost/unit Contribution/unit Contribution margin Sales Volume Revenue % of Sales Expense Contribution zzzzzz zzzzzazoaz 48.72% [quantity] $4.00 $1.16 $2.84 71.00% 22,386 $89,543 17.68% $25,967 $63,575 25.77% $4.00 $1.10 $2.90 72.50% 24,441 $97,765 19.31% $26,885 $70,880 28.73% $3.50 $1.10 $2.40 68.57% 10,339 $36,186 7.15% $11,373 $24,813 10.06% $3.50 $1.10 $2.40 68.57% 6,167 $21,583 4.26% $6,783 $14,800 6.00% $3.50 $1.10 $2.40 68.57% 6,167 $21,583 4.26% $6,783 $14,800 6.00% $3.50 $1.10 $2.40 68.57% 10,339 $36,186 7.15% $11,373 $24,813 10.06% $1.25 $1.06 $0.19 15.20% 71,605 $89,506 17.68% $75,901 $13,605 5.51% $1.28 $1.06 $0.22 17.19% 86,798 $111,101 21.94% $92,006 $19,096 7.74% $1.25 $1.10 $0.15 12.00% 2,346 $2,933 0.58% $2,581 $352 0.14% $506,387 $259,653 $246,734 Break-Even Point (BEP) Months Revenue 12.16 $513,090 $230,000 Decrease to: Total Fixed Costs Price/unit Variable cost/unit Contribution/unit Contribution margin Sales Volume Revenue % of Sales Expense Contribution [$] [$] [$] [$] [%] [quantity] [$] 48.72% $4.00 $1.16 $2.84 71.00% 22,386 $89,543 17.68% $25,967 $63,575 25.77% $4.00 $1.10 $2.90 72.50% 24,441 $97,765 19.31% $26,885 $70,880 28.73% $3.50 $1.10 $2.40 68.57% 10,339 $36,186 7.15% $11,373 $24,813 10.06% $3.50 $1.10 $2.40 68.57% 6,167 $21,583 4.26% $6,783 $14,800 6.00% $3.50 $1.10 $2.40 68.57% 6,167 $21,583 4.26% $6,783 $14,800 6.00% $3.50 $1.10 $2.40 68.57% 10,339 $36,186 7.15% $11,373 $24,813 10.06% $1.25 $1.06 $0.19 15.20% 71,605 $89,506 17.68% $75,901 $13,605 5.51% $1.28 $1.06 $0.22 17.19% 86,798 $111,101 21.94% $92,006 $19,096 7.74% $1.25 $1.10 $0.15 12.00% 2,346 $2,933 0.58% $2,581 $352 0.14% $506,387 $259,653 $246,734 Break-Even Point (BEP) [$] [%] Months Revenue 11.19 $472,043 2 ta the if the selling prices per products TOTAL BRAND 01 BR01-01, BRO105, BR01 00 BRO1 07. BRU10 BROT 09, Plarities 91 207201222 2223327433 z ! **222fil 216 48 29% That is the BC ir the Variable Cost/unit are increased and/or decreased while the costs and the price per products remain the same TOTAL BRAND 01 $221,89 | Ble01 01. | BB0 H0014 ) | BBU 14 Bill 1, | ETt13 | His 107. SHOP 18. E801 casternate = Social are m 494


