

Question: Write a working R program for the below question. Data provided Question3.dat is as seen below. V1 V2 V3 0.264 0.608 0.37 -0.025 -0.349 0.089
Write a working R program for the below question. Data provided
Question3.dat is as seen below.
"V1" "V2" "V3" 0.264 0.608 0.37 -0.025 -0.349 0.089 0.228 -0.001 -0.011 -0.998 -1.074 -0.122 -0.31 0.126 -0.164 -0.311 -0.176 -0.346 0.559 0.767 0.099 -0.823 -0.751 -0.219 0.984 1.128 -0.098 -1.04 0.272 1.694 -0.138 -0.054 0.509 -3.184 -1.677 -0.665 0.009 0.578 -0.25 1.841 -0.46 -0.909 -1.431 1.547 1.862 0.927 0.255 -0.494 -1.427 0.175 0.601 0.979 -0.586 -1.665 0.194 -1.609 -1.807 -1.994 -0.393 -0.778 0.103 -0.202 0.483 -1.412 -1.626 -1.312 1.144 2.563 1.693 0.85 -0.038 -2.891 0.752 0.358 0.563 -1.824 -1.492 -0.791 0.859 0.348 -0.065 -0.946 -1.838 -1.239 0.283 -0.67 0.385 1.72 2.237 1.854
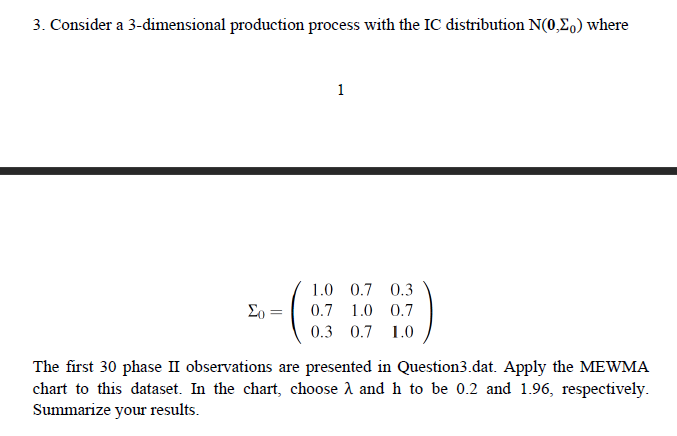
3. Consider a 3-dimensional production process with the IC distribution N(0,0) where 1 0=1.00.70.30.71.00.70.30.71.0 The first 30 phase II observations are presented in Question3.dat. Apply the MEWMA chart to this dataset. In the chart, choose and h to be 0.2 and 1.96 , respectively. Summarize your results
Step by Step Solution
There are 3 Steps involved in it

Get step-by-step solutions from verified subject matter experts