

Question: Write a working R program Question2.dat V1 V2 V3 0.197 0.512 0.635 0.457 -0.458 -0.307 -0.039 0.495 -0.301 -0.289 -1.009 -1.062 -0.577 0.009 0.237 -0.315
Write a working R program
Question2.dat
"V1" "V2" "V3" 0.197 0.512 0.635 0.457 -0.458 -0.307 -0.039 0.495 -0.301 -0.289 -1.009 -1.062 -0.577 0.009 0.237 -0.315 -0.621 0.124 0.089 0.651 0.809 -0.319 -1.005 -0.55 0.133 0.792 1.291 0.18 0.792 -0.067 -0.182 0.018 -0.091 0.564 0.316 -1.194 0.127 0.154 0.265 -0.435 -1.166 -0.324 -0.755 0.415 -0.065 0.045 -0.203 0.267 0.237 0.708 0.054 0.016 -0.926 -0.402 1.499 0.563 0.434 -1.604 -2.048 -2.574 1.569 1.043 1.12 0.52 1.079 1.584 0.563 1.685 1.725 -0.643 -1.054 -2.292 -0.047 0.707 2.015 1.595 1.73 1.583 -0.061 0.329 1.027 1.072 0.611 0.802 1.795 0.661 0.787 0.028 1.114 2.102
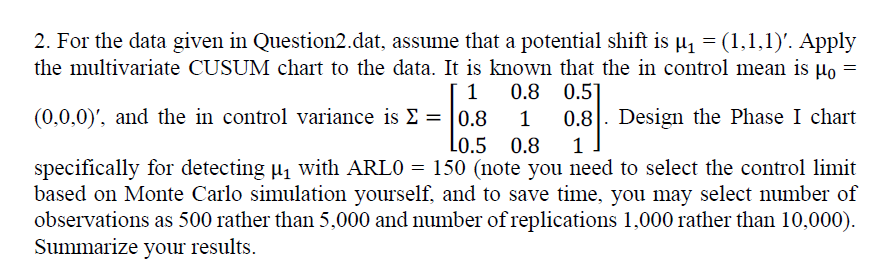
2. For the data given in Question2.dat, assume that a potential shift is 1=(1,1,1). Apply the multivariate CUSUM chart to the data. It is known that the in control mean is 0= (0,0,0), and the in control variance is =10.80.50.810.80.50.81. Design the Phase I chart specifically for detecting 1 with ARL0 =150 (note you need to select the control limit based on Monte Carlo simulation yourself, and to save time, you may select number of observations as 500 rather than 5,000 and number of replications 1,000 rather than 10,000 ). Summarize your results
Step by Step Solution
There are 3 Steps involved in it

Get step-by-step solutions from verified subject matter experts