

Question: Write all the MATLAB command and show the results from the MATLAB program Note: Turn the grid on, label axes and put a title
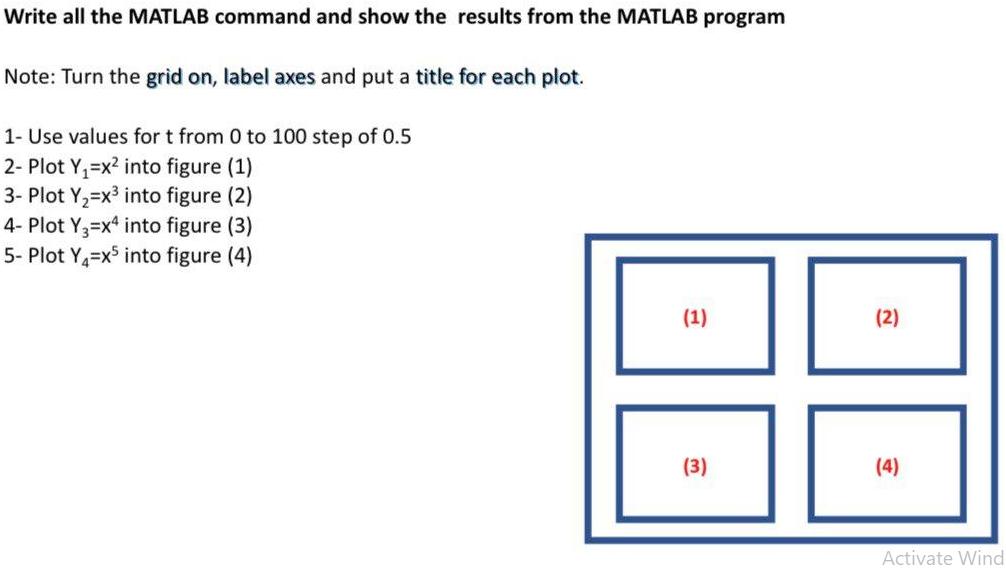
Write all the MATLAB command and show the results from the MATLAB program Note: Turn the grid on, label axes and put a title for each plot. 1- Use values for t from 0 to 100 step of 0.5 2- Plot Y=x2 into figure (1) 3- Plot Y2=x into figure (2) 4- Plot Y3x4 into figure (3) 5- Plot Yx5 into figure (4) (1) (2) (3) (4) Activate Wind
Step by Step Solution
There are 3 Steps involved in it
1 Expert Approved Answer
Step: 1 Unlock

Heres the MATLAB code to generate the plots Matlab Define the time vectort 005100 Plot Y1 x2figure1p... View full answer
Question Has Been Solved by an Expert!
Get step-by-step solutions from verified subject matter experts
Step: 2 Unlock
Step: 3 Unlock