

Question: Write an awk script that produces a report from an input file. The report summarizes sales data as recorded for sales stations. The input file
Write an awk script that produces a report from an input file. The report summarizes sales data as recorded for sales stations. The input file contains sales data for several years, however, your report should only list data for the year 2014.
The awk script file name must be "z123456.report", where z123456 is your Z-id. The awk script is invoked from the command line with an input file that contains data for multiple years:
awk -f z123456.report inputfile. txt
The lines in the input file have the following fields:
year: four digit integer number
month: three letter abbreviation of a month
station: one letter station code
sale amounts: floating point numbers, with 2 significant digits. Each input line will have at least one and at most 10 amount fields.
Here is an example of input sales data ==> click here to download
2011 Jan X 29.44 17.33 43.21 2014 Jan Y 32.32 12.12 99.00 1.99 2012 Jan X 321.11 12.34 10.99 2012 Feb Y 1.99 12.75 2012 Feb X 32.99 65.78 98.76 2014 Jan Y 12.99 17.44 21.34 2012 Mar X 11.45 ...
Your awk script should produce a report that lists the 2014 sales amount per month and station. In addition the report should list the sum of all sales per station for the year 2014, the total sales for the year, and how many records from the input file were processed.
see below input file.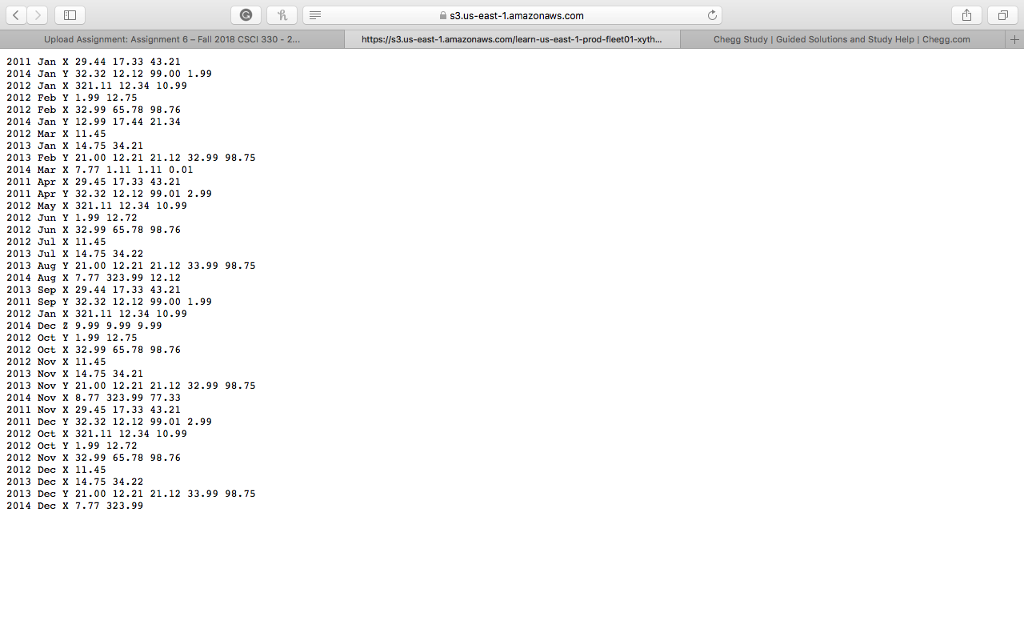
s3.us-east-1.amazonaws.com Upload Assignment: Assignment 6- Fall 2018 CSCI 330 https://s3.us-east-1 Chegg Study | Guided Solutions and Study Help I Chegg.com 2011 Jan X 29.44 17.33 43.21 2014 Jan Y 32.32 12.12 99.00 1.99 2012 Jan X 321.11 12.34 10.99 2012 Feb Y 1.99 12.75 2012 Feb X 32.99 65.78 98.76 2014 Jan Y 12.99 17.44 21.34 2012 Mar X 11.45 2013 Jan X 14.75 34.21 2013 Feb Y 21.00 12.21 21.12 32.99 98.75 2014 Mar X 7.77 1.11 1.11 0.01 2011 Apr X 29.45 17.33 43.21 2011 Apr Y 32.32 12.12 99.01 2.99 2012 May X 321.11 12.34 10.99 2012 Jun Y 1.99 12.72 2012 Jun X 32.99 65.78 98.76 2012 Jul X 11.45 2013 Jul X 14.75 34.22 2013 Aug Y 21.00 12.21 21.12 33.99 98.75 2014 Aug X 7.77 323.99 12.12 2013 Sep X 29.44 17.33 43.21 2011 Sep Y 32.32 12.12 99.00 1.99 2012 Jan X 321.11 12.34 10.99 2014 Dec 2 9.99 9.99 9.99 2012 Oct Y 1.99 12.75 2012 Oct X 32.99 65.78 98.76 2012 Nov X 11.45 2013 Nov X 14.75 34.21 2013 Nov Y 21.00 12.21 21.12 32.99 98.75 2014 Nov X 8.77 323.99 77.33 2011 Nov X 29.45 17.33 43.21 2011 Dec Y 32.32 12.12 99.01 2.99 2012 Oct X 321.11 12.34 10.99 2012 Oct Y 1.99 12.72 2012 Nov X 32.99 65.78 98.76 2012 Dec X 11.45 2013 Dec X 14.75 34.22 2013 Dec Y 21.00 12.21 21.12 33.99 98.75 2014 Dec X 7.77 323.99 s3.us-east-1.amazonaws.com Upload Assignment: Assignment 6- Fall 2018 CSCI 330 https://s3.us-east-1 Chegg Study | Guided Solutions and Study Help I Chegg.com 2011 Jan X 29.44 17.33 43.21 2014 Jan Y 32.32 12.12 99.00 1.99 2012 Jan X 321.11 12.34 10.99 2012 Feb Y 1.99 12.75 2012 Feb X 32.99 65.78 98.76 2014 Jan Y 12.99 17.44 21.34 2012 Mar X 11.45 2013 Jan X 14.75 34.21 2013 Feb Y 21.00 12.21 21.12 32.99 98.75 2014 Mar X 7.77 1.11 1.11 0.01 2011 Apr X 29.45 17.33 43.21 2011 Apr Y 32.32 12.12 99.01 2.99 2012 May X 321.11 12.34 10.99 2012 Jun Y 1.99 12.72 2012 Jun X 32.99 65.78 98.76 2012 Jul X 11.45 2013 Jul X 14.75 34.22 2013 Aug Y 21.00 12.21 21.12 33.99 98.75 2014 Aug X 7.77 323.99 12.12 2013 Sep X 29.44 17.33 43.21 2011 Sep Y 32.32 12.12 99.00 1.99 2012 Jan X 321.11 12.34 10.99 2014 Dec 2 9.99 9.99 9.99 2012 Oct Y 1.99 12.75 2012 Oct X 32.99 65.78 98.76 2012 Nov X 11.45 2013 Nov X 14.75 34.21 2013 Nov Y 21.00 12.21 21.12 32.99 98.75 2014 Nov X 8.77 323.99 77.33 2011 Nov X 29.45 17.33 43.21 2011 Dec Y 32.32 12.12 99.01 2.99 2012 Oct X 321.11 12.34 10.99 2012 Oct Y 1.99 12.72 2012 Nov X 32.99 65.78 98.76 2012 Dec X 11.45 2013 Dec X 14.75 34.22 2013 Dec Y 21.00 12.21 21.12 33.99 98.75 2014 Dec X 7.77 323.99
Step by Step Solution
There are 3 Steps involved in it

Get step-by-step solutions from verified subject matter experts