

Question: Write any 5-8 numbers between 1 and 40. They will represent sample data. Calculate Sample Mean ( x? ) and Sample Standard Deviation (s). We
Write any 5-8 numbers between 1 and 40. They will represent sample data.
Calculate Sample Mean ( x? ) and Sample Standard Deviation (s).
We don't know thevalue of population mean because we don't have data for the whole population.
But using this week study material we can predict interval that holds population mean:
x? - is calculated sample mean,E is a Margin of Error.
This is the case when we don't know population standard deviation (case 2),
but we have calculated sample standard deviation (s).
Here is the formula for Margin of Error:
n - sample size (5,6,7,or 8).
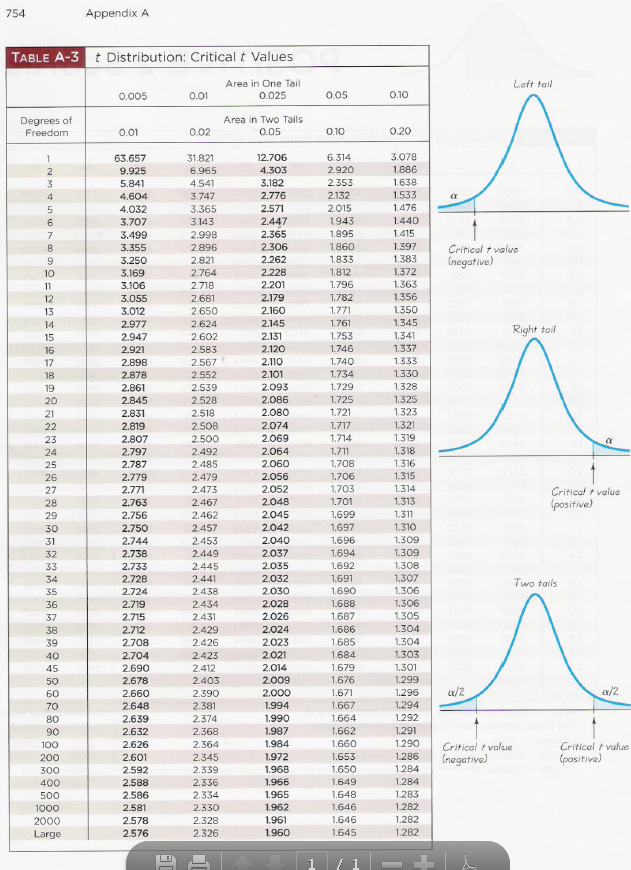
ta/2 is not ta divided by 2, it's just t-value from the
Appendix Table for t-Distribution .
TheDegree of Freedomin this table is df = (n-1), sample size minus one.
Consider Confidence Level 90% (0.90).
Significance Level? = 1 - Conf.Level = 1 - 0.90 = 0.10
To find ta/2in the Table for t-Distribution, use row with df=n-1
and the column with Area in Two Tails equal 0.10.
Here are steps to follow:
1) Write 5-8 numbers between 1 and 40; this will be your sample data.
2) Calculate sample mean (x) and sample standard deviation (s).
3) Use Appendix Table A-3. t-Distributionto find t-value.( Table is attach)
4) Calculate Margin of Error (E) using theformula above.
5) Write Confidence Interval for Population Mean:?= x? E
\f
Step by Step Solution
There are 3 Steps involved in it

Get step-by-step solutions from verified subject matter experts