

Question: WRITE MATLAB CODE Task 6 If you enter the command membrane (1), the Matlab Logo is shown as a surface plot. When you execute the
WRITE MATLAB CODE
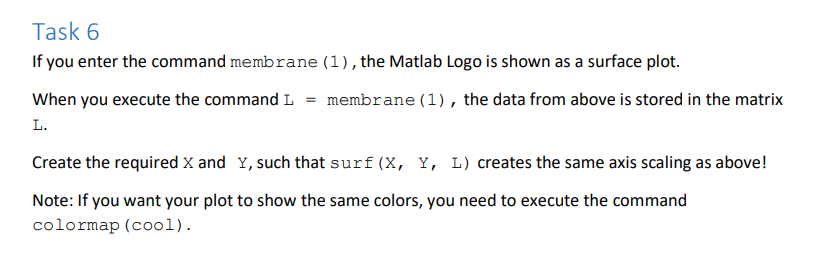
Task 6 If you enter the command membrane (1), the Matlab Logo is shown as a surface plot. When you execute the command L = membrane (1), the data from above is stored in the matrix L. Create the required X and Y, such that surf (X, Y, L) creates the same axis scaling as above! Note: If you want your plot to show the same colors, you need to execute the command colormap (cool)
Step by Step Solution
There are 3 Steps involved in it
1 Expert Approved Answer
Step: 1 Unlock

Question Has Been Solved by an Expert!
Get step-by-step solutions from verified subject matter experts
Step: 2 Unlock
Step: 3 Unlock