

Question: WRITE MATLAB PROGRAM PLEASE Part 3: Carrier mobility as a function of Tand doping The majority carrier drift mobility as a function of doping concentration
WRITE MATLAB PROGRAM PLEASE
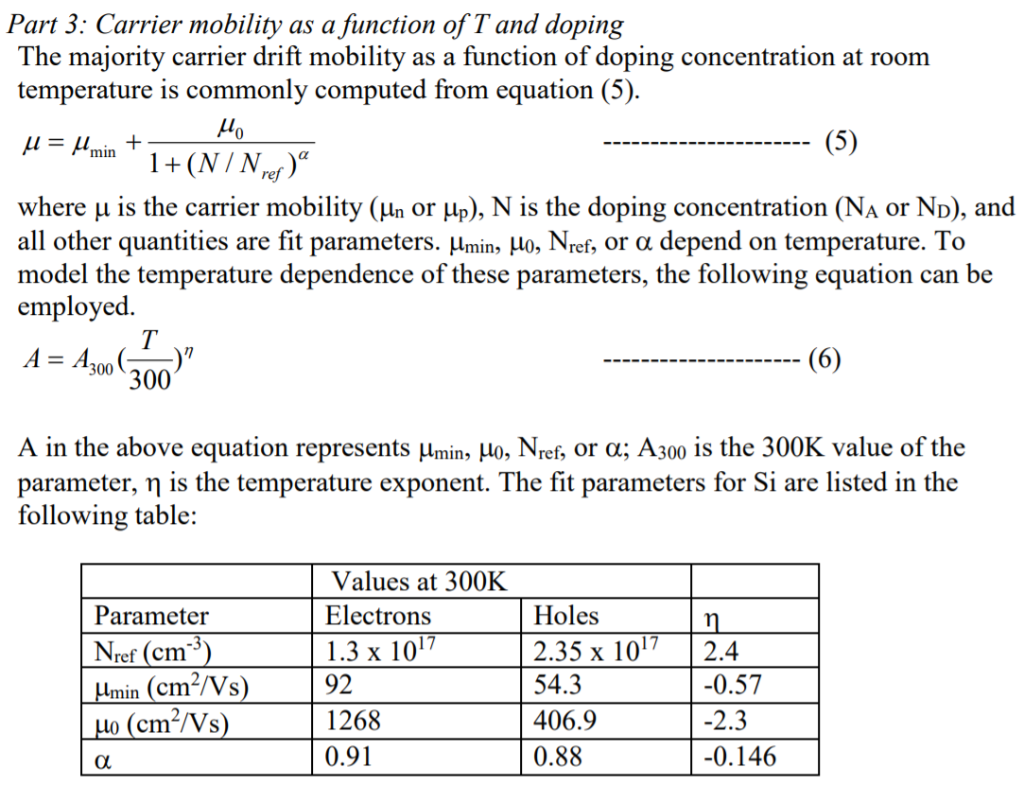
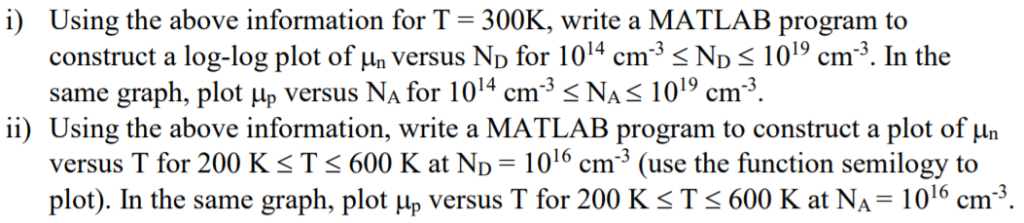
Part 3: Carrier mobility as a function of Tand doping The majority carrier drift mobility as a function of doping concentration at room temperature is commonly computed from equation (5). 0 where is the carrier mobility (Hn or ), N is the doping concentration (NA or ND), and all other quantities are fit parameters. min, 0, Nef, or depend on temperature. To model the temperature dependence of these parameters, the following equation can be employed 300 A in the above equation represents umin, uo, Nref, or a; A300 is the 300K value of the parameter, is the temperature exponent. The fit parameters for Si are listed in the following table: Values at 300K Electrons 1.3 x 10¹⁷ 92 1268 0.91 Holes 2.35 x 10172.4 54.3 406.9 0.88 Parameter -3 ref (cm min (cm2/Vs 0.57 2.3 0.146 i) Using the above information for T 300K, write a MATLAB program to construct a log-log plot of un versus No for 104 cm3 S ND S 1019 cm3. In the same graph, plot up versus Na for 1014 cm3 s NAS 101 cm3 1) Using the above information, write a MATLAB program to construct a plot of versus T for 200 K sTs 600 K at ND 1016 cm3 (use the function semilogy to plot). In the same graph, plot up versus T for 200 K S Ts 600 K at NA-1016 cm3. Part 3: Carrier mobility as a function of Tand doping The majority carrier drift mobility as a function of doping concentration at room temperature is commonly computed from equation (5). 0 where is the carrier mobility (Hn or ), N is the doping concentration (NA or ND), and all other quantities are fit parameters. min, 0, Nef, or depend on temperature. To model the temperature dependence of these parameters, the following equation can be employed 300 A in the above equation represents umin, uo, Nref, or a; A300 is the 300K value of the parameter, is the temperature exponent. The fit parameters for Si are listed in the following table: Values at 300K Electrons 1.3 x 10¹⁷ 92 1268 0.91 Holes 2.35 x 10172.4 54.3 406.9 0.88 Parameter -3 ref (cm min (cm2/Vs 0.57 2.3 0.146 i) Using the above information for T 300K, write a MATLAB program to construct a log-log plot of un versus No for 104 cm3 S ND S 1019 cm3. In the same graph, plot up versus Na for 1014 cm3 s NAS 101 cm3 1) Using the above information, write a MATLAB program to construct a plot of versus T for 200 K sTs 600 K at ND 1016 cm3 (use the function semilogy to plot). In the same graph, plot up versus T for 200 K S Ts 600 K at NA-1016 cm3
Step by Step Solution
There are 3 Steps involved in it

Get step-by-step solutions from verified subject matter experts