

Question: Write the 5 3D plots using the format provided in the example To visualize more complex shapes and figures in 3D we need to use
Write the 5 3D plots using the format provided in the example
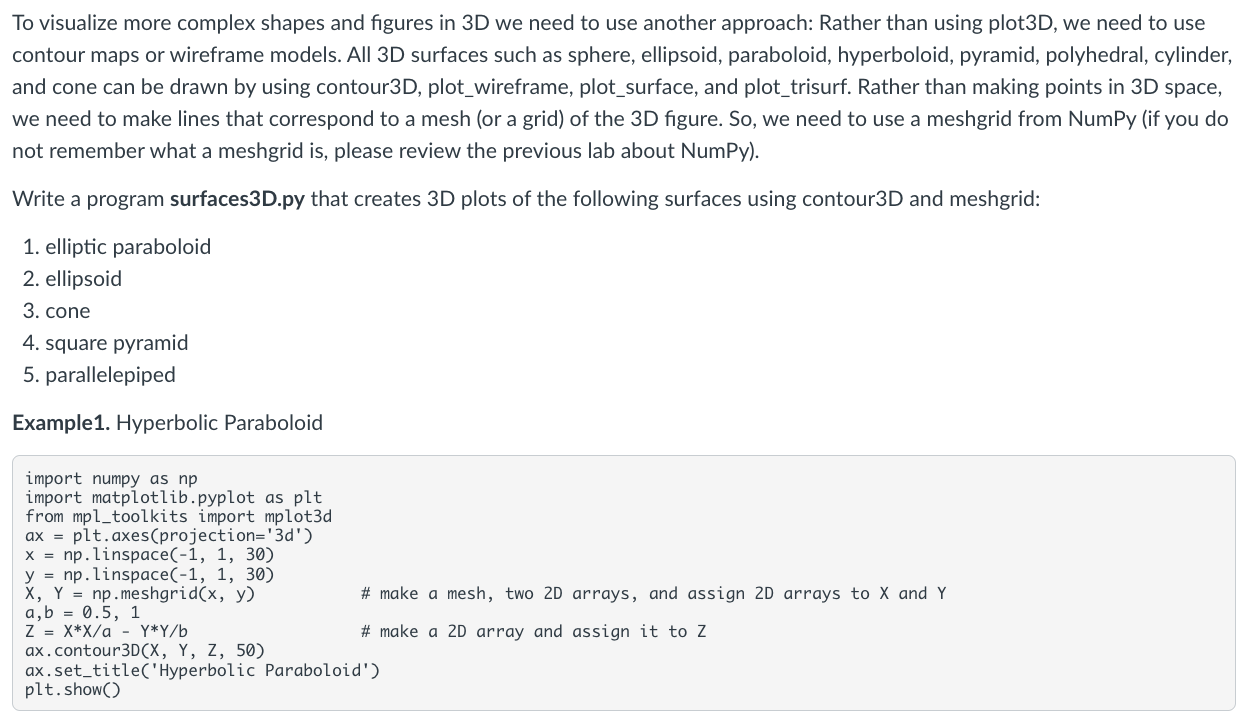
To visualize more complex shapes and figures in 3D we need to use another approach: Rather than using plot3D, we need to use contour maps or wireframe models. All 3D surfaces such as sphere, ellipsoid, paraboloid, hyperboloid, pyramid, polyhedral, cylinder, and cone can be drawn by using contour3D, plot_wireframe, plot_surface, and plot_trisurf. Rather than making points in 3D space, we need to make lines that correspond to a mesh (or a grid) of the 3D figure. So, we need to use a meshgrid from NumPy (if you do not remember what a meshgrid is, please review the previous lab about NumPy). Write a program surfaces3D.py that creates 3D plots of the following surfaces using contour3D and meshgrid: 1. elliptic paraboloid 2. ellipsoid 3. cone 4. square pyramid 5. parallelepiped Example1. Hyperbolic Paraboloid
Step by Step Solution
There are 3 Steps involved in it

Get step-by-step solutions from verified subject matter experts