

Question: WRITE THE CODE & THE OUTPUTS 3. Bar graph. Make a vector of 5 random values and plot them on a bar graph using red
WRITE THE CODE & THE OUTPUTS
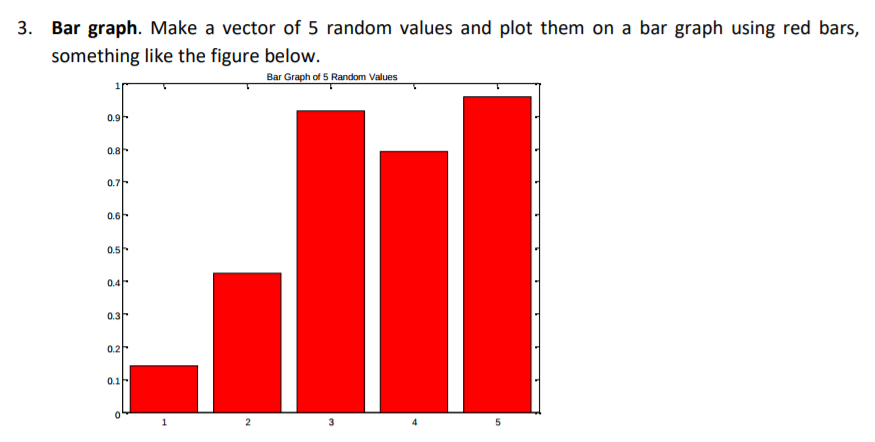
3. Bar graph. Make a vector of 5 random values and plot them on a bar graph using red bars, something like the figure below Bar Graph of 5 Random Values 0.9 0.8 0.6 0.5 0.3 0.2
Step by Step Solution
There are 3 Steps involved in it
1 Expert Approved Answer
Step: 1 Unlock

Question Has Been Solved by an Expert!
Get step-by-step solutions from verified subject matter experts
Step: 2 Unlock
Step: 3 Unlock